India’s power sector rarely draws attention, yet it quietly keeps the economy moving. From growing cities to factory floors, electricity supports daily activity at every level. With the increase in urbanisation, the pattern of consumption is changing, resulting in an increase in demand. Power consumption in FY2025 was 1,694 billion units.
Thus, the sector has received a boost with an increasing growth trajectory. It is against this background that Adani Green Energy Limited and Tata Power Limited are identified as the two market-leading but distinct players. This article seeks to explain the positioning of both companies in the power sector.
Power Sector Overview
India is one of the largest electrical networks across the globe; it is currently the third-biggest producer as well as consumer of electricity worldwide. The installed generating capacity as of December 2025 was nearly 510 GW.
Renewable energy has become a key focus of India’s energy strategy. The government is also targeting a non-fossil fuel-based energy generation of 500 GW by 2030. The renewable installations have already reached close to 253 GW by the end of last year, and that is primarily in solar and wind sources.
Looking ahead, ₹42 lakh crores of investments in the next ten years would focus on renewable power, storage, grid improvements, and transmission enhancements for a more robust power sector.
Adani Green Energy Overview
Adani Green Energy Ltd, or AGEL, is a pure-play renewables company that is engaged in the large-scale production of solar, wind, and hybrid energy. AGEL is a part of the Adani group and is engaged in a business model that is driven by long-term clean energy contracts and, to some extent, the commercial power market.
The company has an ambitious target of reaching 50 GW of capacity by 2030. More than 90% of the total portfolio is secured through a long-term Power Purchase Agreement (PPA), while the rest operates as a merchant plant.
One of the main drivers of growth is the renewable energy park at Khavda in Gujarat, which is currently the largest globally in the works. AGEL has already commissioned over 5GW at Khavda, but plans to increase it to 30GW by 2029, a target which management has reiterated will be achieved on time.
Tata Power Overview
Tata Power Company Ltd is an extremely diversified energy company in the Indian market, which operates in the areas of generation, transmission, and distribution. It is distinct in the sense that it is not a purely renewable energy company but is engaged in the entire value chain of the electricity sector.
In FY26, it has charted a capital expense budget of approximately ₹25,000 crores. More than 60% of this outlay focuses on renewable energy sources, whereas approximately 30% targets transmission and distribution capacity enhancement, such as smart grids. The rest of the investments are in other business segments.
Adani Green vs Tata Power: Financial Overview
Both companies continue to report stable operating performance, though their financial profiles remain structurally different. The table below compares Adani Green vs Tata Power across key metrics, based on H1FY26 data:
| Metrics | Adani Green Energy Ltd | Tata Power Company Ltd |
| Revenue (₹ Cr) | 6,088 | 33,580 |
| EBITDA (₹ Cr) | 5,651 | 6,867 |
| EBITDA Margin (%) | 91.8% | 20.4% |
| Net Profit(₹ Cr) | 1,468 | 2,507 |
| Net Profit Margin (%) | 24.1% | 7.4% |
| EPS (₹) – March, 25 | 3.54 | 2.88 |
| Dividend – March, 25 | Nil | 20% |
| Installed Capacity | 17.2 GW (100% RE) | 26.3 GW (RE + thermal) |
| Order Pipeline | 18+ GW | 10.4 GW |
| P/E Ratio (TTM) | 70x | 29x |
| Debt-to-Equity Ratio | 4.52 | 1.86 |
| ROE (%) | 14.6% | 11.0% |
1. Revenue
Revenue is a measure of income generated through core operations. Adani Green’s revenue was at ₹6,088 crore, mostly through long-term renewable PPAs. Tata Power’s revenue was at ₹33,580 crore, thanks to its presence in the areas of generation, transmission, distribution, and new businesses in the renewables space.
2. EBITDA
EBITDA showcases operational efficiency. Adani Group’s EBITDA stood at approximately ₹5,651 crore along with margins of 91.8%, which showcases the company’s asset-light model. Tata Power’s EBITDA was approximately ₹6,867 crores along with lower margins of 20.4%, which showcases the capital-intensive end-to-end value chain model.
3. Net Profit
Net profit shows earnings after all costs. Adani Green earned ₹1,468 crore, translating into superior margins of 24.1%. Tata Power reported ₹2,507 crore, benefiting from scale, though profitability is spread across diverse businesses. Its net profit margin was 7.4%
4. EPS
EPS is a measure of profitability per share. Adani Green’s EPS was around ₹3.54, while Tata Power reported about ₹2.88 EPS.
5. Dividend
Adani Green is still holding on to their profits for expansion and did not announce any dividends. Tata Power gave a 20% dividend distribution rate.
6. Installed Capacity
Operational renewable capacity of Adani Green reached 17.2 GW, which is entirely renewable. Tata Power’s overall capacity is 26.3 GW, including renewables, thermal, and hydro.
7. Order Pipeline
Adani Green has among the biggest pipelines in the world with over 18 GW, thanks to its mega project at Khavda. Tata Power has a total pipeline of approximately 10.4 GW of green projects in development.
8. P/E Ratio
The P/E ratio shows how much investors are willing to pay for each rupee earned by the company. Adani Green is priced at 70 times earnings, which factors in the long-term growth in the renewable business. Tata Power is priced at 29 times, which is more in line with the industry averages.
9. Debt-to-Equity Ratio
Adani Green’s leverage is still high at around 4.5 times, which is project finance-driven. Tata Power’s leverage of around 1.86 is more normalised.
10. ROE
Adani Green delivered an ROE of 14.6%, more than Tata Power’s 11%, indicating stronger equity returns despite higher leverage.
Now, let us have a look at the summary of Adani Green vs Tata Power financial comparison:
| Metric | Adani Green Energy Ltd | Tata Power Ltd |
| Revenue | ★ | |
| EBITDA Margin | ★ | |
| Net Profit Margin | ★ | |
| EPS | ★ | |
| Dividend | ★ | |
| Installed Capacity | ★ | |
| Order Pipeline | ★ | |
| P/E Ratio | ★ | |
| Debt-to-Equity Ratio | ★ | |
| ROE | ★ | |
| Stock Returns | ★ |
Stock Price Performance
Adani Green Energy Limited is currently trading at ₹922.51, as of January 14, 2026. The stock has made a 52-week high of ₹1,167.23 and a 52-week low of ₹747.74.
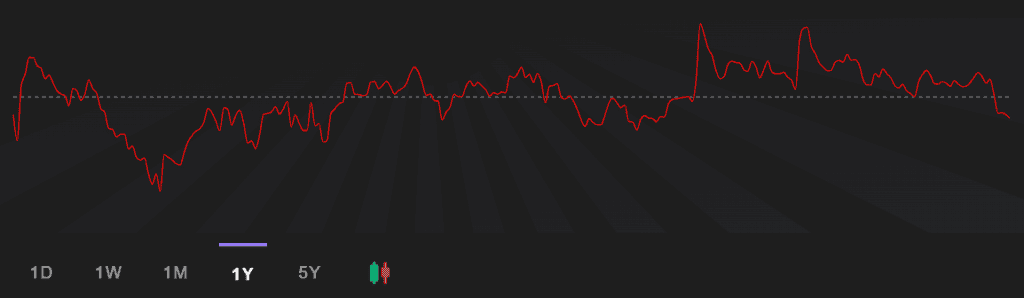
Source: Adani Green Energy Stockgro
As of January 14, 2026, Tata Power Ltd is trading at ₹364.14. Further, the stock has made a 52-week high and low of ₹414.35 and ₹322.67, respectively.
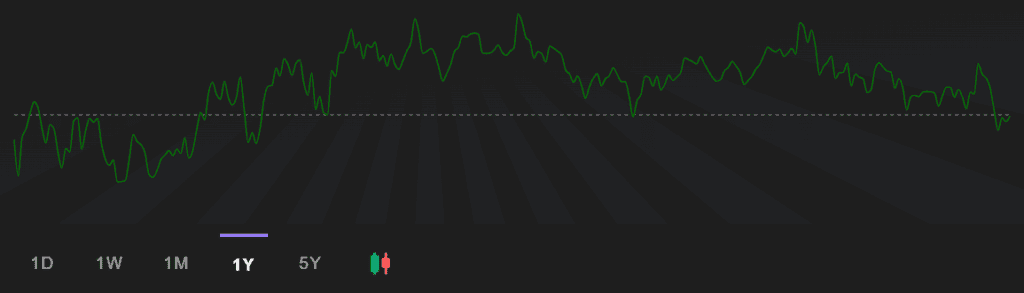
Source: Tata Power Stockgro
| Returns(As on January 14, 2026) | Adani Green Energy Ltd | Tata Power Ltd |
| 1 Month | -10.76% | -3.11% |
| 6 Months | -9.59% | -7.75% |
| 1 Year | -5.07% | -0.21% |
| 3 Year | -24% | 21% |
Tata Power continues to show relatively stronger performance over time, supported by more stable price behaviour and smaller drawdowns. Short-term pressure has been visible across both stocks, but the extent differs.
- Over the past month, Adani Green fell by 10.76%, while Tata Power declined by 3.11%.
- The trend remains similar over medium horizons. In the last six months, Adani Green slipped 9.59%, compared with a 7.75% decline in Tata Power.
- Over a one-year period, Adani Green posted a 5.07% drop, while Tata Power stayed nearly flat with a marginal 0.21% fall.
- The gap widened over three years, where Adani Green declined 24%, against Tata Power’s 21% gain, highlighting a clear divergence in long-term return consistency.
Bottomline
Both companies play vital roles in India’s evolving power sector, each with different strengths. Adani Green excels in operational efficiency, high margins, and a significant renewable pipeline, but this comes with higher leverage and more volatile stock performance.
Tata Power provides scale and diversification, leading in revenue, dividends, capacity, and balance sheet strength. As a result, it has produced more stable returns over time compared to its peers.
With continued government support, both are expected to benefit, but which one is best suited depends on the level of risk an investor can take.