Alpha and beta are two metrics that constitute the bedrock of modern portfolio theory. For anyone who wants to build a successful portfolio of stocks and hit their investment goals, knowing these terms is an absolute must. They represent active management, and market dynamics to guide you towards the investments you should be making, and the ones you should be avoiding.
In this article, we’re going to understand what these concepts are, how they’re calculated, and how you can leverage them to make smarter decisions.
Let’s get to them one by one.
What is beta?
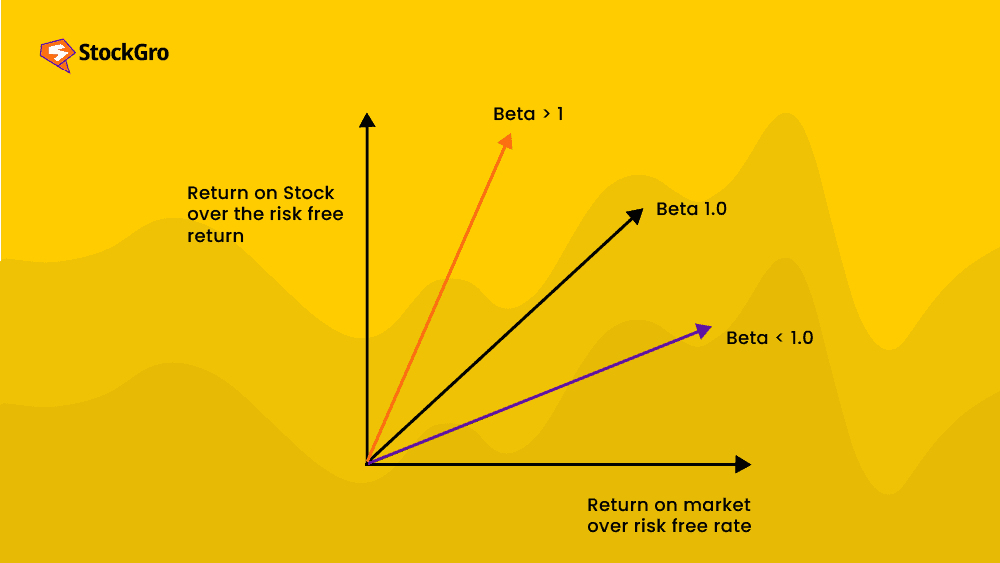
We’re starting with beta because as a concept, it’s easier to understand than alpha. Beta is a measure of how volatile a particular stock is relative to a benchmark – which is usually an index but could also be another security.
This means that stocks that have a high beta (β>1) are more volatile than the index fund comparable. For instance, if β for a security is 1.5, it means that the stock moves by a factor of 1.5 when the comparable does, in the same direction. In other words, the stock is said to have 50% more risk than the overall market.
When beta is close to zero, it means that the investment mimics the movement of the compared index. When beta is negative, however, it means that the stock mimics the index but in the opposite direction. Hence, when the index moves, a stock with β = -2 will move in the opposite direction by a factor of two.
You may also like: The Capital Asset Pricing Model (CAPM) – Explained
How is beta used?
In a portfolio of stocks, you can use each security’s beta to estimate how much risk you’re taking relative to the market.
- If your stocks have a beta that’s much higher than indices like NIFTY 50 and SENSEX, it means that you’re taking on a lot of risk with your investments.
- Something close to zero? That means whenever the index becomes more volatile, so does your portfolio.
- If your overall beta is negative, it means that your portfolio will experience negative volatility; when the index goes down, your portfolio goes green.
It is important to align your investment goals and risk appetite with the beta of your stock portfolio. If you’re willing to take on a lot more risk, consider investing in high-beta stocks since they tend to have better returns in the long term in exchange for greater short-term risk.
However, if you’re more conservative, sticking close to the index is a better strategy.
Note: Keep in mind, however, that beta numbers become less effective the older they are because, fundamentally, a stock’s risk level can drastically change over time. This also means that beta is not good at predicting future returns and measures past performance only.
What is alpha?
Alpha is a bit more complicated. It is defined as the excess return on an investment after you’ve adjusted for random fluctuations and market volatility. Alpha is represented by a single number, which indicates the percentage by which your investments outperformed the index or fund you were comparing it to.
It is a historical figure, which means that it can track how your stock or portfolio performed in the past, offering little information about the future.
Alpha = Asset return – Benchmark return
For instance, if your portfolio did 3% better than the SENSEX, your alpha would be +3.
True alpha
Now, you might have heard mutual fund companies claiming to have “high alpha”, implying that they have the skills to beat the index by a lot. But the question arises – which index would you use? When funds invest in small-cap stocks, which have higher risk and higher returns, is NIFTY the right index to use?
In this case, a small-cap index fund is a much more accurate option. While NIFTY’s yearly 10% returns might inflate the fund’s alpha to 3 or even 4, a small cap index might bring it down to 0 or 1. Very few investors have true alpha when market volatility is taken into account. This is also true because it takes more than 10 years to know for sure whether they do.
Also Read: Free float market capitalisation – What is it, and how is it calculated?
Warren Buffett is generally considered to have alpha, meaning that his skill actually gains him better returns than the market. His strategy focuses mostly on value investing, dividend growth, and stability along with the right mix of high-quality and less volatile stocks.
Selecting the right balance
Like we noted with both these metrics, they’re not one-size-fits-all indicators. No indicator is, in fact. They have to be used in conjunction with other technical and fundamental indicators to establish confidence in the investment decision.
What’s more is that they’re only historical metrics – meaning that they have no say over what the future holds.
When analysing your portfolio with alpha and beta, it is helpful to know what your investment goals and objectives are, along with your risk appetite. This will let you adequately measure your target beta for your overall portfolio, and calculate your potential alpha in the short-term.