In the complex world of finance, where uncertainties are plenty, and investment decisions carry substantial consequences, reliable frameworks play a pivotal role. They allow for guided analysis and precise decision-making without being overly subjective.
One such indispensable framework is the Capital Asset Pricing Model (CAPM). The CAPM allows investors around the world a structural approach to understanding the relationship between risk and return on investment.
It acts like a navigational tool that helps investors decipher the complexities of financial markets and allows them to make more informed choices in difficult asset allocation situations.
In this article, we are going to explore what the CAPM is, how it provides a systematic means of evaluating investments, and why it is an indispensable arrow in the financial analyst’s arsenal.
You may also like: Exploring small-caps: Rising stars with significant profit potential
What is the CAPM?
Developed in the 1960s by economists William F. Sharpe, John Lintner, and Jan Mossin, the Capital Asset Pricing Model (CAPM) is a fundamental concept in finance that seeks to quantify the expected return on an investment in relation to its risk. In simpler words, the CAPM estimates whether an investment can provide a worthwhile rate of return proportional to its risk.
It establishes a clear link between the inherent risk of an asset and the potential rewards it offers to investors. This model operates on the principle that investors should be compensated for two types of risk:
- Systematic risk – which is market-wide and cannot be diversified away,
- Unsystematic risk – which can be minimised through diversification.
Throughout the world of finance, the CAPM model is used to put a price on securities that generate market-beating returns but for a much higher risk quotient.
The formula
At its core, this is what the formula for calculating the CAPM looks like:
Expected return = Risk-free rate + (Beta * Market Risk Premium)
- Expected return – This is the rate of return you could expect to earn by holding the asset in question. This is the compensation you get by participating in the risk of holding this asset.
- Risk-free rate – This is the default amount of return an investor like you could earn without having to risk anything; that is, an investment that is considered to have zero risk of default. This is often approximated using stable government bonds as a standard.
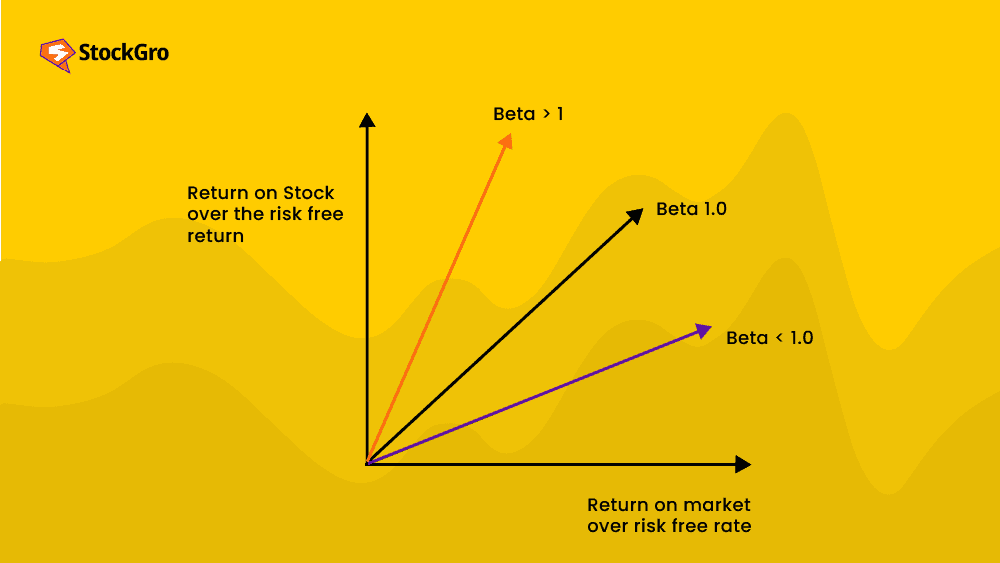
- Beta (β) – This is a measure of the asset’s sensitivity to market movements, which calculates how much an asset tends to move in response to movements in the market.

- An asset with a beta of 1 moves in line with the market; a beta greater than 1 indicates higher volatility than the market, and a beta less than 1 indicates lower volatility. A negative beta suggests that the asset moves inversely to the market.
- Market risk premium – In the above-simplified formula, the expected return of the market minus the risk-free rate has been reduced to the ‘market risk premium.
This represents the additional return over and above the risk-free rate that is required to compensate investors for indulging in a riskier asset.
Also Read: What is Capital Market – an engaging guide for beginners
By plugging these values into the formula, you can estimate the appropriate return you should demand for taking on a certain level of risk with an investment.
Example calculation
Suppose you want to evaluate whether or not to invest in a stock currently trading on the National Stock Exchange (NSE). You decide to use the CAPM to estimate this stock’s expected rate of return and find out if it’s a worthwhile investment.
Here’s the data you have:
- Risk-Free Rate (RF): The current yield on a 10-year Indian government bond is 6%.
- Market Return (RM): The historical average annual return of the Nifty 50 index is 10%.
- Beta (β): The stock’s beta is calculated as 1.2. This means the stock tends to be 20% more volatile than the overall market.
Plugging in these values in the CAPM formula, you get: Expected Return = 0.108 or 10.8%
As per calculations through the CAPM model, the expected return for the stock is 10.8%. This means that according to the model, given the risk of this investment compared to the market, you should theoretically expect to make at least 10.8% to make the investment worth your while.
Hence, if your return based on your risk tolerance and objectives comes out to be more than 10.8%, it’s an attractive investment opportunity. If the return is lower, you might be signing up for more risk without getting much in return.
Praises and criticisms
On the positive side, the CAPM has earned praise throughout the industry for its simplicity and foundational role in modern finance. By creating a relationship between risk and expected return, the CAPM has given investors insight into whether their investments make sense both on a micro and macro level.
In the broader scheme of things, you could use this model to effectively diversify your portfolio with investments that suit your investment needs and risk appetite and be sure that you’re making informed decisions every time you decide to rebalance.
Also Read: Your guide to real estate investment trusts
On the flip side, the CAPM has also gotten some flak from the finance community for failing to incorporate market inefficiencies into calculations. Critics argue that real-world markets exhibit complexities, such as market frictions, behavioural biases, and information asymmetry, none of which are accounted for by the CAPM.
Analysts also say that for a modern financial model, the CAPM relies too much on historical data (to estimate betas), making it lose out on current and ever-evolving market dynamics.
Conclusion
Despite criticisms from some parts of the industry, the significance of CAPM lies in its ability to guide investors in assessing whether an investment is adequately compensating them for the risk they are assuming.
This answers one of the most fundamental questions that every investor asks themselves before putting down their money – Is this worth it?
While the CAPM certainly has its assumptions and limitations, it serves as a foundational tool for both individual investors and financial professionals, aiding them in making more informed decisions.

