A trader’s ability to interpret market signals is paramount as every decision they make holds the potential for profit or loss. Among myriad trading tools, few are as powerful as the Hammer Candlestick. Hammer patterns, signalling potential trend reversals with striking visuals, can shape the course of trading fortunes.
Let us help you discover the Hammer Candlestick Patterns and understand why it is a powerful tool for traders to shape their trading strategy.
What is a candlestick?
In financial markets, candlestick patterns are graphical illustrations that represent price movements. While using this tool, the length of the candlestick’s wick is on focus, which indicates the price movement and potential market sentiment.
A wick, appearing as a thin line, extends above and below the body of the candlestick’s body, portraying the range of prices between the highest and lowest points throughout a certain period (one minute/hour/day, etc.).
A pattern can be formed with a series of candlesticks representing open, high, low, and close asset prices during a period.
Traders utilise candlestick patterns in conjunction with other technical tools to analyse price charts of financial assets, including stocks, currencies, commodities, etc.
You may also like: Essential guide to candlestick patterns for beginners
What is a Hammer Candlestick pattern?
There can be varied candlestick patterns in terms of formation, each with its own interpretation and implications for price direction. A recognised candlestick pattern is the hammer.
Others include doji, shooting star, engulfing, and hanging man. The pattern’s name – hammer – is based on its shape’s resemblance to a hammer.
It is a single candlestick pattern, indicating a potential bullish reversal in a price chart. In other words, it suggests a downward price swing that has encountered significant buying pressure, resulting in a potential shift in market sentiment and the likelihood of a bullish reversal.
Price action traders can identify reliable price reversal points by observing hammer chart patterns. Hammer patterns usually appear after a period of bearish trend or at the end of a correction.
It is characterised by its distinct appearance, consisting of the following main components:
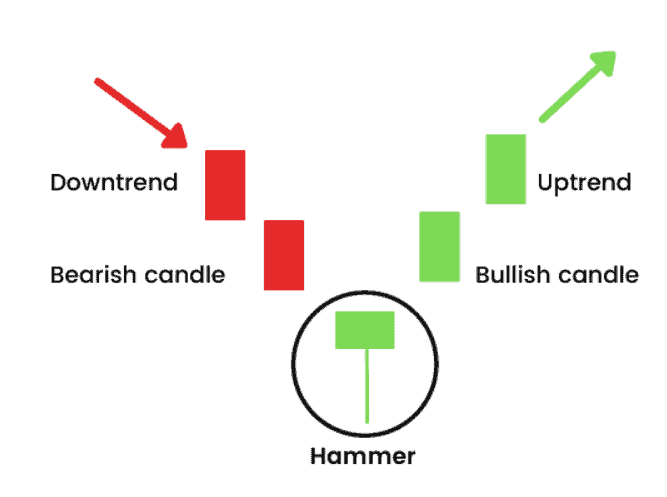
- Position: A hammer pattern forms near the bottom of a trend.
- Shape: This single candlestick pattern has a small body and a long lower shadow (i.e. shadow extends downward from the body), at least twice that of its body. Generally, the upper shadow does not exist. If present, it usually tends to be of minimal length.
- Colour: Hammer’s body can be green (bullish) or red (bearish).
What is Hammer Candlestick’s interpretation?
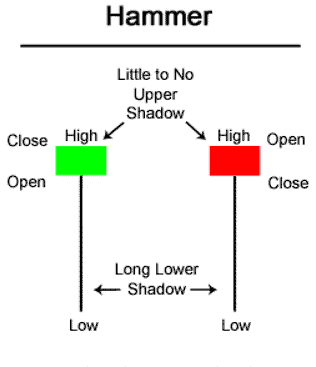
Characterised by its short green or red candle and long wicks, hammer patterns signify a rejection of lower market prices. Consider the following factors to interpret the hammer candlestick pattern:
- Green hammer refers to a higher closing price of the candle than the opening price. On the other hand, a red hammer indicates a higher opening price of the candle than the closing price.
However, the body colour does not matter much because whether the colour is red or green, the hammer pattern often indicates a bullish price reversal. - A lower wick represents a low price during the session. Therefore, a long lower wick in this bullish reversal pattern suggests prices moved significantly lower during a specific trading period.
The basic interpretation of a hammer candlestick is that sellers pushed the price down significantly but could not maintain the downward pressure and eventually were overpowered by buyers.
In other words, it suggests a trend reversal where buying pressure ultimately controlled the final price action. For example, a candlestick pattern opens at Rs. 30. As the bearish traders begin to sell, the stock value declines. When it reduces to a significant level, bullish traders perceive it as an opportunity to take positions in the market.
Also Read: A beginner’s guide to the share market
Confirmation and follow up to validate the signal’s reliability
While a single hammer can offer valuable insights, traders often observe the subsequent candlestick’s behaviour and the overall market context for confirmation from subsequent price action.
When considering a hammer pattern in isolation, there is no certainty of a price reversal, and it does not help traders determine the price target.
Therefore, they look for other technical indicators, like divergence on an oscillator, or candlestick patterns, like bullish engulfing patterns, etc., that can support the trend reversal signal identified by the hammer pattern.
Generally, traders perceive it as a compelling indicator of a potential trend reversal if three or more bearish candlesticks precede it. Additionally, the next candle that forms after the hammer should end above its closing.
Example – Hammer Candlestick pattern
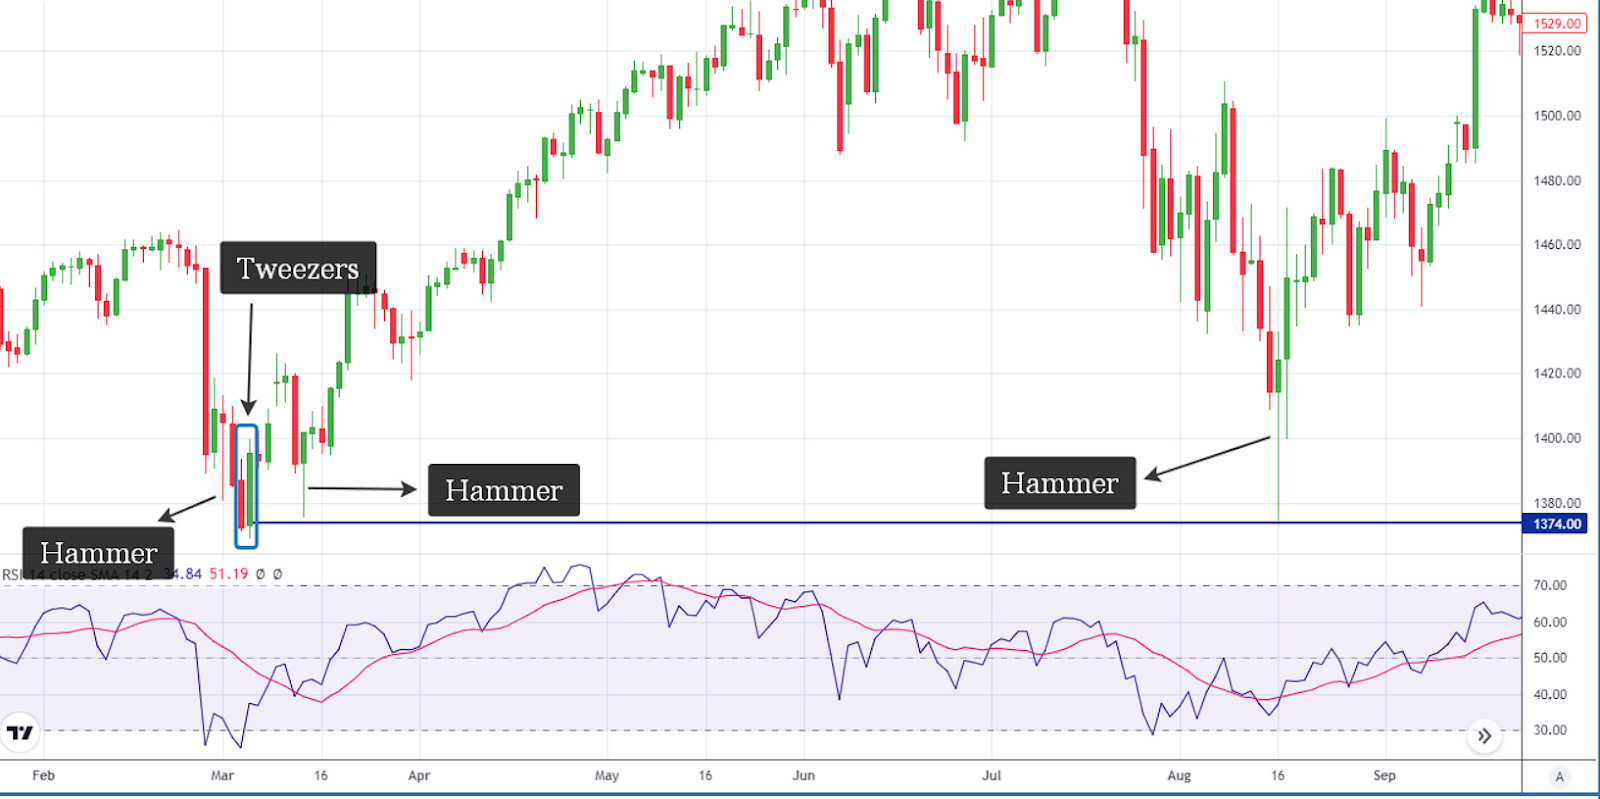
Source: TradingView
The above chart had a hammer pattern because it began after a correction. This red hammer, formed on 16th March, was the first candle that indicated trend reversal or uptrend.
Another hammer emerged from the top. This candlestick is a hammer because it is still at the bottom of a trend.
On 16th August, a powerful hammer appeared. It was a good indicator because it was green with an elongated lower wick.
The second and third hammers brought trading opportunities as the first two hammers, and the tweezers were the confirmers of the third hammers. Also, it formed after a significantly long downtrend.
Inverted Hammer Candlestick pattern
The Inverted Hammer in the stock market also serves as a bullish reversal pattern, but a long upper wick distinguishes it. It forms when the opening price is less than the closing price. During a downtrend, an inverted hammer indicates that there is buying pressure.
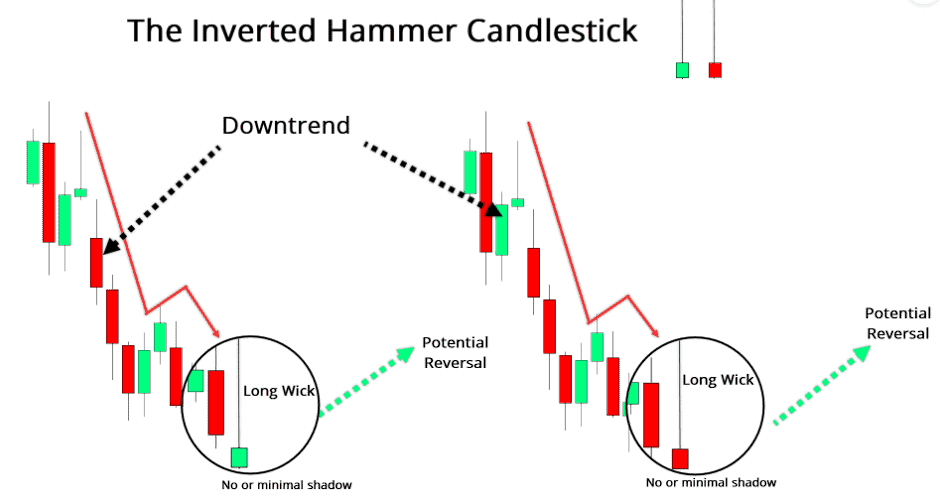
It is less reliable as it is not as bullish as the ordinary hammer candlestick. Traders can not trust it too much as it is only a warning for bearish traders that there is a chance that bullish traders can test the market again.
Traders do not trade an inverted hammer pattern without strong supporting signals. The time frame of the candlesticks can be decreased to know what happened yesterday and get a hint if it is worth taking the risk or not.
Example – Inverted Hammer Candlestick pattern

Source: TradingView
In this chart, there are two inverted hammers. The first was on 26th January and the second on 8th March.
There were a few signals that supported the first hammer. The first signal was a strong hammer that appeared in Feb, two days before an inverted hammer. The second signal was triggered at the price level 4260, where many candles failed to break. The third signal was an inverted hammer showing an overbought condition.
Also Read: Understanding after-hours trading and strategies for success
The next inverted hammer emerged in March and warned the bears with the following green candle, making tweezers. It was a good confirmation. Finally, a fresh uptrend began after the inverted hammer, enhancing its appeal from a risk/reward perspective as it formed subsequent to a long downtrend.
The closing
The hammer candlestick pattern stands as a prominent tool for technical analysis associated with trend reversal. Skilled traders can leverage the hammer candle patterns with other trading additional candlestick patterns to navigate the complexities of the financial markets and trade cautiously.