Stock Overview
| Ticker | DIXON |
| Industry/Sector | Electronics Manufacturing Services (EMS) |
| Market Cap | ₹26,000 Cr (Large Cap) |
| CMP (Current Market Price) | ₹15,490 |
| 52-Week High/Low | ₹16,245/₹10,456 |
| P/E Ratio | 88.7 (vs Industry Avg. of 72.4) |
| Dividend Yield | 0.12% |
| Beta | 0.98 (vs NIFTY 50) |
| Free Float | 44% |
About Dixon Technologies
Dixon Technologies is India’s leading Electronics Manufacturing Services (EMS) provider, benefiting from the “Make in India” initiative and Production Linked Incentive (PLI) schemes. The company operates in segments like consumer electronics, home appliances, lighting, and mobile manufacturing, catering to top global and domestic brands.
Key drivers of growth:
- PLI scheme: Dixon is a major beneficiary of the Indian government’s PLI schemes, especially in mobile phones and IT hardware manufacturing. These incentives ensure significant capacity expansion and margin growth.
- Union Budget 2025 expectations: Industry sources suggest that the upcoming budget may include additional incentives for electronics exports and tax benefits for EMS players, further strengthening Dixon’s position.
- Strategic partnerships: Collaboration with global giants like Samsung and Motorola for mobile manufacturing and increased focus on export markets.
- Operational efficiency: Dixon’s backward integration in manufacturing leads to cost advantages and competitive pricing.
Competitor analysis for Dixon Technologies
Key financial metrics (FY24 Snapshot)
| Company | Revenue (₹ Cr) | Net Profit (₹ Cr) | P/E | EBITDA Margin (%) | Focus Area |
| Dixon Technologies | 34,287 | 1,047 | 88.7 | 6.5% | Consumer electronics, mobiles, LED. |
| Amber Enterprises | 5,625 | 215 | 70.2 | 9.4% | AC’s, components. |
| Syrma SGS | 2,795 | 160 | 55.4 | 14.5% | PCBs, IoT solutions, exports. |
| Elin Electronics | 1,486 | 63 | 48.8 | 11.2% | Small appliances, lighting. |
| Bharat FIH | 26,000 | 1,800 (est.) | NA | 7.0% | Mobiles, exports. |
Key insights on Dixon Technologies
- Revenue leadership:
Dixon leads the pack with ₹34,287 crore in revenue, driven by its diversified portfolio and PLI schemes. - Profitability:
Dixon’s EBITDA margin (6.5%) trails Syrma (14.5%) and Elin (11.2%) due to scale-focused pricing in mobiles and consumer electronics. - Growth catalyst:
Dixon’s PLI-driven expansion positions it as a key beneficiary in the EMS and electronics export space. - Market position:
While Dixon dominates India’s EMS market, Bharat FIH poses significant competition in the mobile export segment with global expertise.
Recent financial performance (Q3 FY25)
| Metric | Q3 FY25 | Q3 FY24 | YoY Growth |
| Revenue | ₹10,454 cr | ₹4,813 cr | +117.3% |
| EBITDA | ₹710 cr | ₹292 cr | +143.2% |
| Net Profit | ₹216 cr | ₹97 cr | +122.7% |
| EBITDA Margin | 6.8% | 6.1% | +70 bps |
| Segment Revenue – Mobile | ₹5,280 cr | ₹2,438 cr | +116.5% |
| Segment Revenue – Consumer Electronics | ₹3,400 cr | ₹1,900 cr | +78.9% |
Exceptional revenue growth driven by strong demand for mobile and consumer electronics segments.
Margins improved due to economies of scale and higher operating leverage in mobile manufacturing.
Valuation insights
- Relative valuation:
- Dixon’s current Price-to-Earnings (P/E) ratio is 88.7, which means investors are paying 88.7 rupees for every rupee Dixon makes in profit. However, Dixon’s rapid growth trajectory and strong market position within India’s electronics manufacturing services (EMS) space could justify this higher valuation.
- EV/EBITDA: Another way to gauge if a stock is “expensive” or “cheap” is by looking at Enterprise Value (how much the entire company is worth) compared to Earnings Before Interest, Taxes, Depreciation, and Amortization (a measure of profit). At 54.8x, Dixon is trading above its 5-year average of 50.2x, which suggests it’s priced higher now than it has been in the past.
- A DCF model estimates what Dixon’s shares are really worth by predicting how much money the company will make in the future, then adjusting for risks and the time value of money. Here, the model suggests an “intrinsic” price of about ₹17,300—about 14.5% more than the stock’s current price.
Key assumptions taken:
- Revenue Growth: 24% yearly increase from FY25 to FY30.
- Terminal Growth Rate: 4 post FY30
- WACC: 11%, which is the blended cost of using both debt and equity to fund the business. (Cost of Debt: 7.13%) ( Cost of Equity 12.88%)
Key risks to watch
- Geopolitical risks: Heavy reliance on imports for key components exposes Dixon to supply chain disruptions.
- Margin pressure: Volatile raw material prices and currency fluctuations may impact profitability.
- Execution risk: Scaling up capacity under the PLI schemes will require seamless execution and adherence to regulatory norms.
Technical outlook on Dixon Technologies
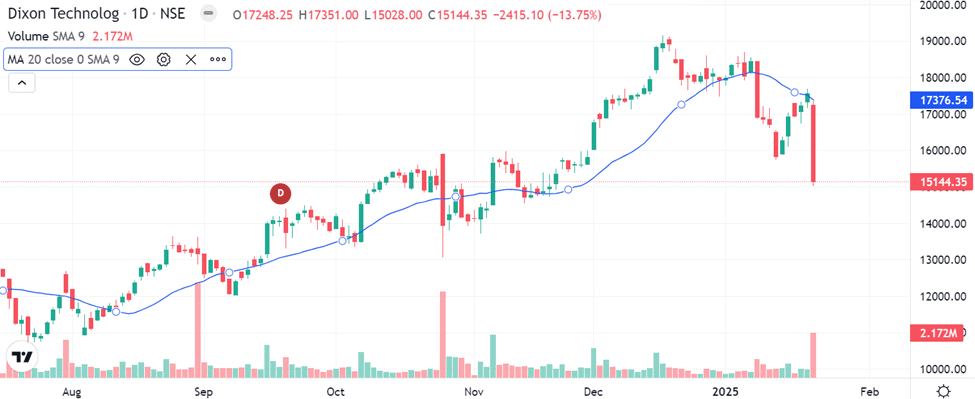
- Short-Term: Dixon has breached its 20-day moving average (₹17,376), indicating near-term bearish momentum.
- RSI: 63 (Bullish).
- Resistance: ₹15,500
- Support: ₹14,700
- Volume Trend: Strong upward trend with a 20-day average volume increase of 18%.
Dixon stock recommendation
Current Stance: Buy with a target price of ₹17,300 (12-month horizon). Near-term pain is likely.

Why buy now?

Robust growth visibility supported by the PLI scheme and expected policy tailwinds in the upcoming budget.

Leadership position in India’s EMS sector with strong partnerships and diversified product offerings.

Portfolio fit: Dixon is ideal for growth-oriented investors seeking exposure to India’s manufacturing story and the EMS sector.
If you found this helpful and want regular stock trade calls, check out my StockGro profile here: https://stockgro.onelink.me/vNON/6m6ykj0d
Dixon Technologies: Budget 2025 opportunities
- Higher PLI Allocation: Expanded capacities in mobiles and electronics could add ₹2,500–₹3,000 crores/year in revenue.
- Tax Incentives: Lower corporate taxes may boost EBITDA margins by 50–70 basis points.
- Export Incentives: Increased subsidies could raise export revenue contribution from 12% to 18% by FY27.
- Support for Component Manufacturing: Reduced import dependency to improve cost efficiency.
- R&D Push: Incentives for high-tech electronics to help diversify into high-margin products.
- GST Cuts on Electronics: Demand will likely surge for LED TVs and washing machines.