Stock overview
| Ticker | TCS |
| Sector | Information Technology |
| Market Cap | ₹ 13,06,500 Cr |
| CMP (Current Market Price) | ₹ 3,589 |
| 52-Week High/Low | ₹ 4,592/ ₹ 3,457 |
| P/E Ratio | 26.8 x |
| Beta | 0.9 (Low volatility) |
About TCS
Founded in 1968, TCS is a pioneer in the Indian IT sector and part of the Tata Group. It offers consulting, business solutions, and IT services globally, with a strong presence across North America, Europe, and Asia.
The company’s focus on innovation, digital transformation, and client-centric strategies has cemented its position as a market leader. TCS caters to a vast and varied customer base.
Let’s do a deep dive into the company’s financial performance and understand what makes it a must have portfolio stock for all the investors.
Primary growth factors for TCS
1. Digital transformation boom
- Strong demand for cloud services, AI, and cybersecurity.
- TCS’s partnerships with AWS, Microsoft, and Google strengthen its market position.
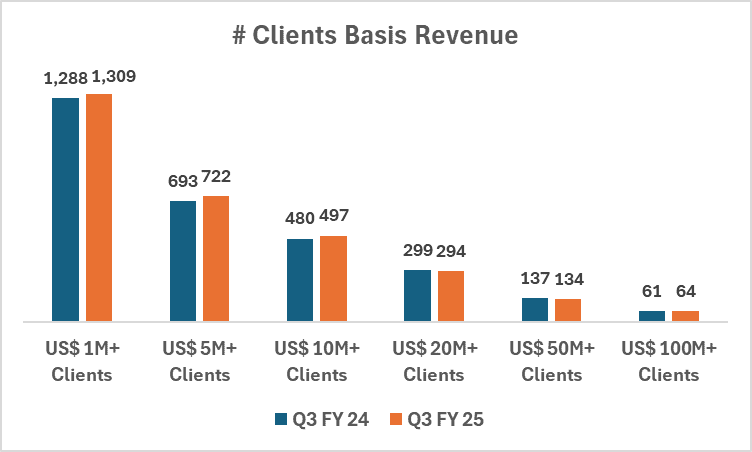
- Global client base
- 60+ clients contribute over $100 million in annual revenue.
- Long-term contracts with Fortune 500 companies provide stable cash flows.
- Here’s a breakdown of clients contribution basis the revenue generated from those clients :
- Diversified portfolio with moderate growth across Major segments
- TCS revenue portfolio is well diversified across BFSI, Consumer Business, Lifesciences, Healthcare and Manufacturing.
- All the verticals are growing at a moderate pace except Healthcare, hence there is lower dependency across any major vertical.
- Here’s a breakdown of revenue contribution and growth across all the business verticals :
| Domain/Vertical | Business Contribution | YoY Growth |
| BFSI | 31% | 0.9% |
| Consumer Business | 15% | 1.1% |
| Life Sciences and Healthcare | 10% | -4.3% |
| Manufacturing | 8% | 0.4% |
| Technology and Services | 8% | 0.4% |
| Media and Communication | 6% | -10.6% |
| Energy, Resources and Utilities | 6% | 3.4% |
| Others | 16% | 41.0% |
| Total | 100% | 4.5% |
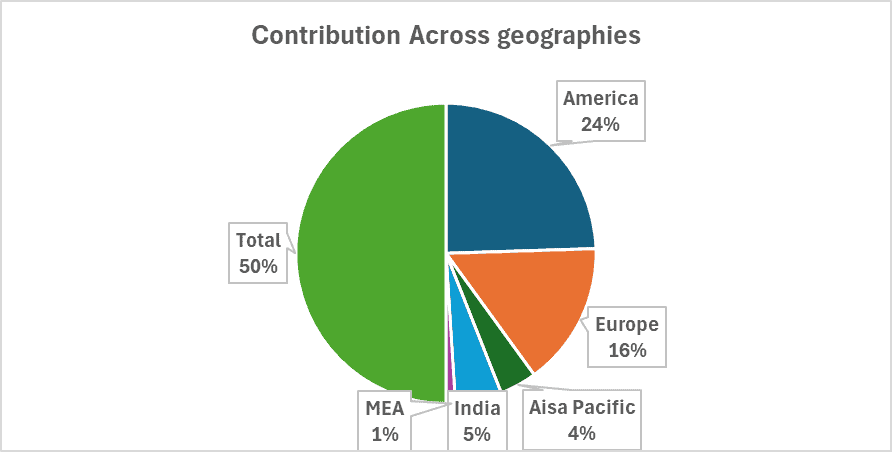
- Diversified geographical sales mix
- TCS’s revenue portfolio is well diversified across major geographies such as America, Europe, Asia Pacific, etc.
- Here’s a breakdown of revenue contribution across all the business geographies
- Cost optimisation & automation
- Investments in automation tools like Ignio enhance service delivery and reduce costs.
- Strong talent pool
- A workforce of over 600,000 employees, with ongoing upskilling initiatives in emerging tech.
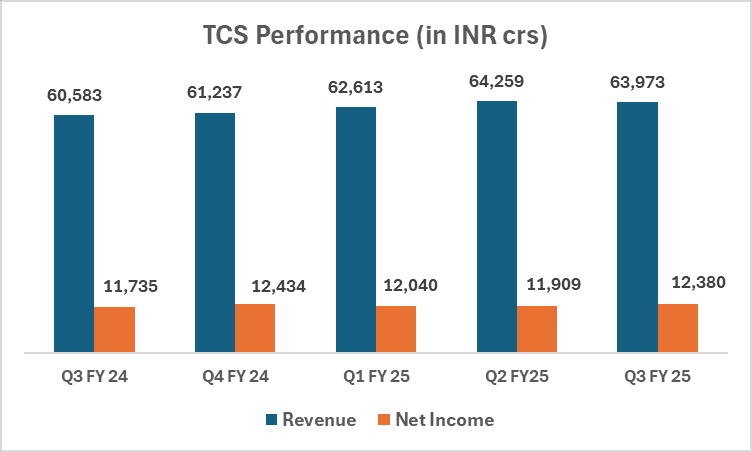
Q3 FY25 Financial Performance
| Metric | Q3 FY 25 | YoY Growth |
| Revenue | 63,973 cr | 5.6% |
| Operating Income | 15,657 cr | 3.3% |
| Profit | 12,380 cr | 5.5% |
| Net Margin | 19,4% | 0 bps |
- TCS reported an impressive 5.6% growth in Revenue and 5.5% increase in Profit in Q3 FY 25.
- The IT giant reported similar margins to Last year at 19.4%.
- Despite macroeconomic uncertainties, TCS has delivered consistent revenue growth and healthy margins, reinforcing its operational efficiency.
- Here’s the revenue and profitability trend for TCS on a quarterly basis :
Detailed competition analysis for TCS
| Company | Market Cap | Profit | P/E | RoCE |
| TCS | 13,06,500 cr | ₹ 12,380 cr | 26.8x | 64.3% |
| Infosys | 7,00,100 cr | ₹ 6.806 cr | 25.3x | 40.0% |
| HCL Tech | 4,22,700 cr | ₹ 4,591 cr | 24.8x | 29.6% |
| Wipro | 2,98,200 cr | ₹ 3,353 cr | 24.1x | 16.9% |
| Tech Mahindra | 1,46,100 cr | ₹ 983 cr | 39.0x | 11.9% |
- While TCS trades at a premium valuation, its industry-leading margins and superior return ratios justify the higher multiple.
Company valuation insights: TCS
As per Discounted Cash Flow analysis:
It estimates the intrinsic value of TCS share based on expected future cash flows:
- Intrinsic Value Estimate: ₹4,100 per share
- Upside Potential: 14%
- WACC: 10%
- Terminal Growth Rate: 3%
Given its robust fundamentals and growth visibility, TCS remains an attractive long-term bet, though short-term upside may be limited.
Major risk factors affecting TCS
- Global Slowdown Risk:A global economic slowdown could impact client budgets and delay new deals.
- Currency Fluctuations: A stronger rupee against the USD could dent revenue, given TCS’s high exposure to North America.
- Talent Retention & Wage Inflation: High attrition or rising wages could pressure margins, though TCS’s employee engagement initiatives mitigate this risk.
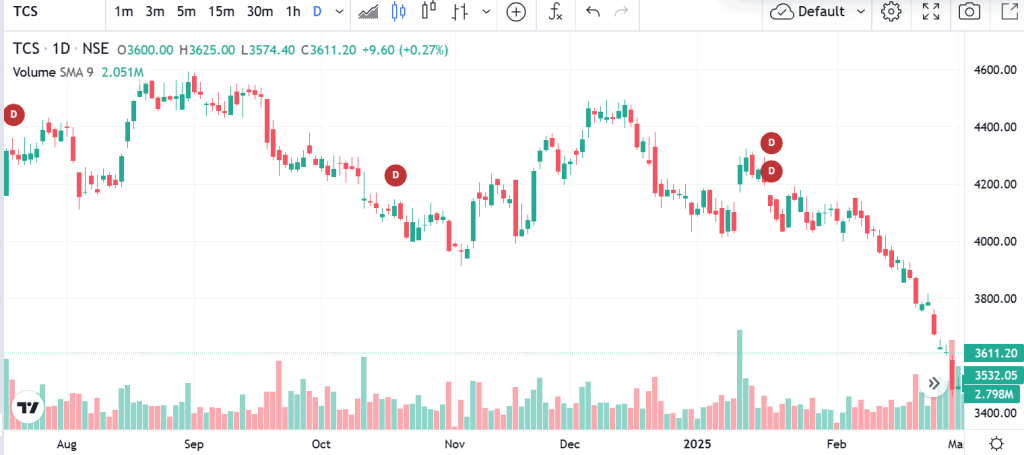
Technical analysis of TCS share
- Resistance: ₹3,750
- Support: ₹3,500
- Momentum: Bullish
- RSI (Relative Strength Index): 58 (Neutral to Bullish)
- MACD (Moving Average Convergence Divergence): Positive crossover, indicating upward momentum
- 50-Day Moving Average: ₹3,550 (acting as near-term support)
- 200-Day Moving Average: ₹3,400 (long-term support)
TCS is in a steady uptrend, with indicators suggesting further upside, especially on dips toward support levels.
TCS stock recommendation by Ketan Mittal
Current Stance: BUY with a 12-month target of ₹4,100.

Outlook: Positive, with steady upside potential

Recommended Action: Hold or accumulate on dips
If you found this helpful and want regular stock trade calls, check out my StockGro profile here: https://stockgro.onelink.me/vNON/6m6ykj0dConclusion
TCS remains a cornerstone of stability and innovation within the Indian IT sector. Its strong financials, global reach, and digital transformation expertise make it a compelling long-term investment. While valuations are on the higher side, the company’s growth potential and market leadership justify the premium.