
Interpreting market patterns to benefit from its trends is an intelligent trading strategy, and traders who leverage this make maximum profits and minimise losses. One such tool that helps in analysing the strength of market trends is the ADX indicator.
Conceptualised by J. Welles Wilder in 1978, this is a powerful tool that helps traders make decisions around buying and selling.
ADX full form is Average Directional Index. ADX helps assess whether the current market trend of increasing prices or decreasing prices is strong. Understanding this helps investors analyse the pricing pattern of stocks, thereby determining the right time to buy or sell.
What are trending markets?
A trending market is a market condition where prices of a particular stock keep moving in the same direction over a specific amount of time.
When the price of a stock keeps moving upward, i.e., it keeps increasing – the market shows an upward or bullish trend.
When the price of a stock keeps moving downward, i.e., it keeps decreasing – the market shows a downward or bearish trend.
There may be some differences in the daily movements, but the average trend of prices during a specific period should follow the same direction in a trending market.
Understanding market trends helps investors in recognising potential future opportunities.
You may also like: What are interim dividends?
What is the directional movement index?
The directional movement index (DMI) is an essential component in analysing ADX.
This tool helps in identifying the direction in which the market trend is progressing – using various price points, DMI suggests whether the market is moving upward (bullish) or downward (bearish)
DMI can be of two types: Positive DI (+DI) and Negative DI (-DI)
The formula for calculating DI:
+DI = Current high price – Previous high price
-DI = Previous low price – Current low price
When the difference between the current and the previous high price is greater than the difference between the previous and the current low price, +DI is used, indicating that the market is trending upward/positive/bullish.
In the opposite scenario, -DI indicates that the market is trending downward/negative/bearish.
Example:

Let us consider Stock ABC

High as of yesterday: ₹ 25

High as of today: ₹ 28

Low as of yesterday: ₹ 23

Low as of today: ₹25

+DI = 28 – 25 = 3

-DI = 25-23 = 2
Here, the value of +DI is greater than -DI, indicating that +DI or the upward market is currently stronger, making the trend bullish.
Also Read: Earnings Per Share (EPS): What it means and how to calculate it
How is the DMI linked to ADX?
The average directional index comprises DMI, i.e., positive and negative directional indicators.
It is a set of numbers indicating the strength of these trends.
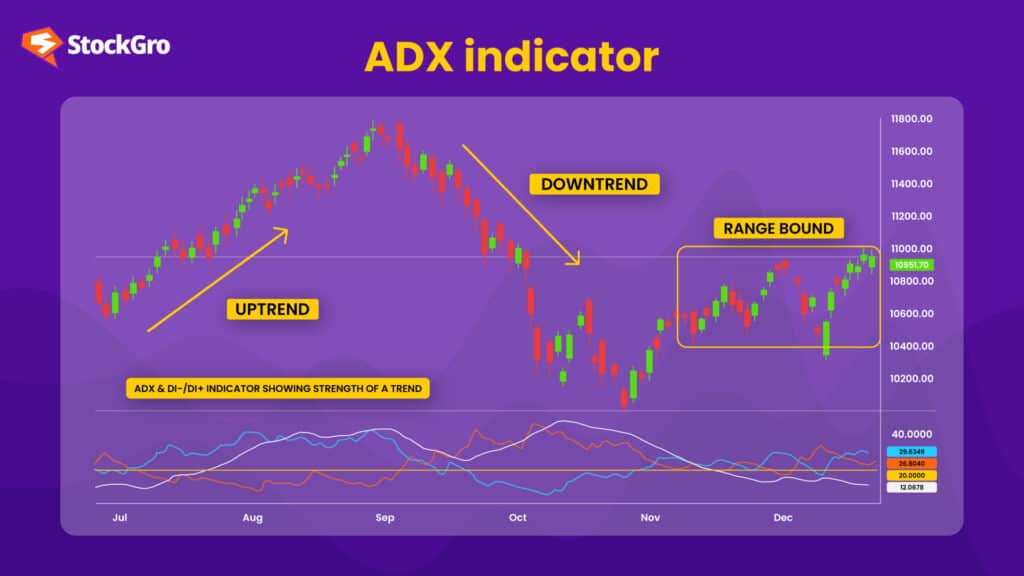
ADX and the DI lines are plotted on a graph, making them easier to comprehend.
When the market is bullish or in an upward trend – the +DI numbers form a line graph on top of the chart. The constant rise in prices indicates a strong trend, and the ADX forms a line close to the positive directional index.
When the market is in a downward trend – the -DI numbers form a line on top, and ADX forms a line close to the negative directional index.
So, based on the directional index that ADX follows on the graph, investors interpret trends in the market.
ADX indicator formula
It requires the calculation of moving averages over a certain period.
Formula, in its simplest form, can be understood as below:
- The ADX, is usually computed for 14 days. (Variable as per requirement)
ADX Indicator Formula;
Day 1 = (DX1 + DX2 + DX3…. DX14) / 14

Day 2 onwards: ADX = ((ADX1 * 13) + Current DX)) / 14

Where, DX = (PD Index – ND Index / PD Index + ND Index) * 100

PDI = (Current Day’s High Price – Previous Day’s High Price / ATR) * 100

NDI = (Previous Day’s Low Price – Current Day’s Low Price / ATR) * 100

ATR (Absolute True Range) = Previous ATR (n-1) + True Range/n
How to use ADX indicator for day trading?
The ADX indicator strategy is an essential technical skill for every trader interested in day trading.
When the ADX follows the positive index line (usually green in colour), ADX indicates that a bullish trend is leading the market.
This is the time for bulls to go long – buy shares.
When the ADX follows the negative index line (usually red in colour), ADX indicates that the bearish trend is strong in the market.
This is when bears go short – sell their shares.
When the ADX isn’t clear, it doesn’t follow any specific trend but is up and down (sometimes termed choppy), which means there is no market trend. In such scenarios, the prices don’t follow a pattern, but are haphazard. This is when traders shouldn’t perform any action on their shares.
Also Read: Do all technical analysis tools work equally well?
The ideal ADX
When the value of ADX is above 25, it indicates a strong trend. This is when the traders must make buying and selling decisions based on a bullish/bearish market.
When the value of ADX is below 20, the market has no specific trend. It isn’t very safe for traders to trade during this period as it is tough to analyse potential opportunities.
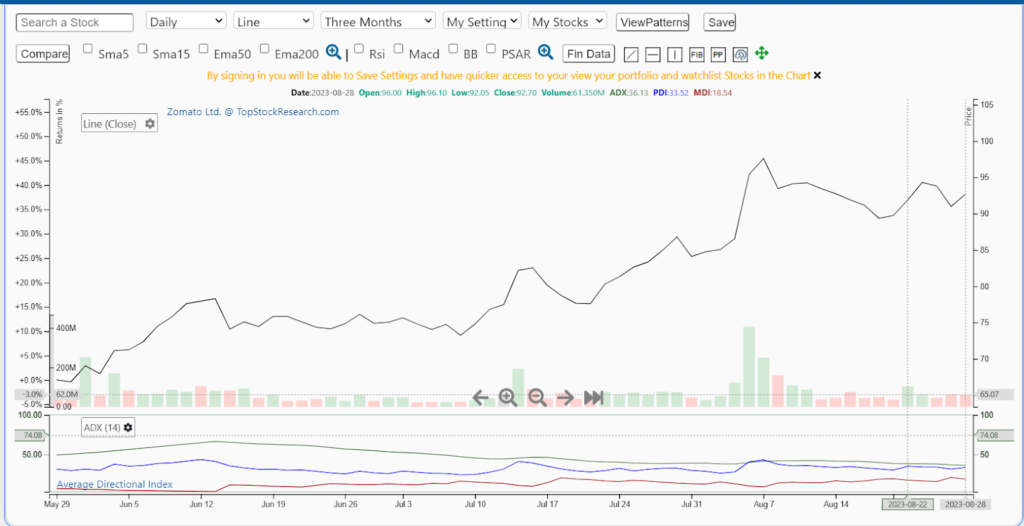
Case study
Below is the sample of the ADX chart and interpretation of Zomato as of 28 Aug 2023.
Bottomline
Unlike crossovers, where two indicators intersect, creating false alarms, ADX is one of the most powerful tools used for traders to maximise profits with minimal risk.
It is usually used along with other indicators like RSI (Relative Strength Index) for accurate results. ADX not only determines the strength of trends but also suggests the beginning of trend reversal patterns, which helps traders make decisions well in advance.