Technical analysis is a tool that uses charts, patterns and indicators to potentially establish the movement of prices. Traders and investors use this technique in the stock market to generate consistent profits. One tool that is employed as part of technical analysis is the ascending triangle pattern. This pattern is seen on a bullish trend and many traders use it to find breakouts.
What is an ascending triangle pattern?
An ascending triangle or the rising triangle chart pattern is a bullish pattern that occurs in an uptrend. It follows a horizontal resistance level and a rising support level. It is a continuous pattern, as it follows the uptrend and gives a breakout in a similar direction as the trend.
Identification of an ascending triangle chart pattern
The ascending triangle pattern is a bullish pattern that can be easily recognised by the existence of the following two parts:
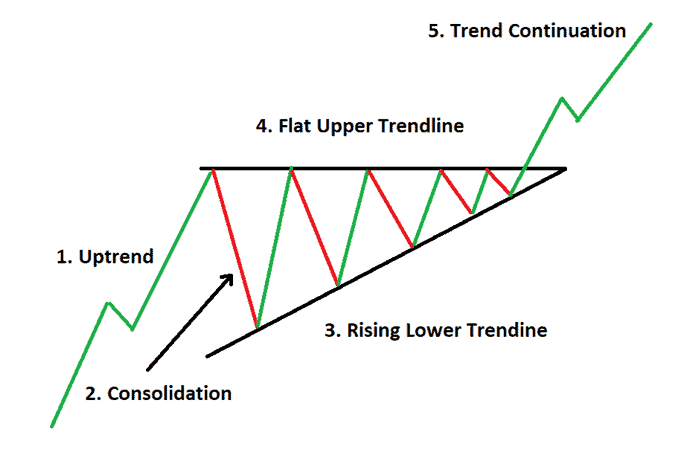
- Flat resistance line: It is a straight line that acts as a potential barrier to the price. Resistance at this level represents a selling pressure becoming significant.
- Rising support line: This is an upward-sloping trendline that is the support level. It shows that buyers are looking to buy the shares even at lower highs.
To further recognise the ascending triangle pattern, you must look for the following characteristics:
- Higher lows: The price consistently forms higher lows, showing buyers are becoming more aggressive.
- Horizontal resistance: The price touches this straight line level at least a minimum of two times without breaking it.
- Lower volume: Volume decreases as the pattern develops, displaying a lower buying that happens for the trades.
Formation of an ascending triangle pattern
If you want to see the ascending triangles breakout, the volume should be increasing. If there is a decrease in trading volume as the pattern forms, it is possible that the trade will be unsuccessful.
While the stop losses create selling pressure, there is also a buying pressure created by buyers which shows a strength in the share, ultimately leading to an ascending triangle pattern breakout.
How do you trade the ascending triangle chart pattern?
Entry point
Traders enter a long (buy) position when the price breaks out from the straight resistance level. This breakout signals a potential continuation of the uptrend.
Stop-loss order
Avoid losses by placing a stop-loss with a buffer order below the ascending support line. This level acts as a critical support. If the price breaks below it, the pattern may have failed.
Price target or exit
The ascending triangle pattern target for the trade can be estimated by measuring the distance between the triangle at its widest point and adding that measurement to the breakout point. It gives you a potential price target for your trade.
To reduce false breakouts, traders often wait for confirmation of the breakout. This involves monitoring volume to ensure it increases when the breakout occurs.
Common pitfalls when trading the ascending triangle chart pattern
Trading the ascending triangle pattern can be a profitable strategy but just like any other trading approach, it comes with its own set of challenges. Here are some common challenges to be aware of when trading this pattern:
False breakouts
One of the most significant pitfalls in trading ascending triangles is false breakouts. Sometimes, the price may appear to break out of the pattern, only to reverse and move in the opposite direction. To cancel out this risk, wait for a confirmation signal.
Lack of volume
If you want to see the ascending triangles breakout, the volume should be increasing. If there is a decrease in trading volume as the pattern forms, it is possible that the trade will be unsuccessful.
Overtrading
Traders are tempted to enter into multiple trades based on ascending triangles in rapid succession, especially if they have had success with the pattern earlier. Overtrading leads to higher risk and higher losses.
Ignoring the market context
Ascending triangles in an uptrend are more reliable. When an ascending triangle chart pattern is in the bearish market, it is a wrong signal and traders should avoid entering into the trade in such a phase. Trading any strategy in isolation, without taking into consideration the broader market conditions, entails risk. Always analyse the market context before entering a trade.
Poor risk management
Failing to set proper stop-loss orders and risking too much capital on a single trade is a common pitfall. Always calculate your position size based on your risk tolerance. Planning for your entry and exit points ahead is also advised.
Ascending Triangle Vs Descending Triangle: Key Differences
Have you ever wondered how certain patterns in the stock market can give you clues about the next big move? Well, ascending and descending triangles are two such patterns that can help traders make informed decisions. Let’s break them down to see what sets them apart:
| Ascending Triangle | Descending Triangle | |
| Shape | Formed by a flat upper trend line and an upward sloping lower trend line. | Formed by a flat lower trend line and a downward sloping upper trend line. |
| Market Sentiment | Bullish sentiment as buyers are pushing prices higher. | Bearish sentiment as sellers are driving prices lower. |
| Breakout Direction | Typically breaks out upwards, signaling a potential bullish move. | Usually breaks out downwards, indicating a possible bearish move. |
| Volume Behavior | Volume often increases as the pattern develops, confirming bullish sentiment. | Volume can vary; often increases as the breakout approaches, indicating bearish pressure. |
| Trading Strategy | Traders may look to buy when the price breaks above the upper trend line. | Traders might consider selling or shorting when the price breaks below the lower trend line. |
| Timeframe | Can appear on various timeframes, from minutes to daily charts. | Also found across different timeframes, suitable for both short-term and long-term trades. |
So basically, ascending triangles signal bullish trends with their upward momentum, making them attractive for buyers, while descending triangle pattern represent bearish trends, often leading traders to sell. Recognizing these patterns can enhance your trading strategy, whether you’re aiming for quick gains or long-term investments.
Pros and Cons of Ascending Triangle
If you’re getting into technical analysis, you might hear about the ascending triangle pattern. Many traders like it because it can suggest that prices might go up.
However, just like any trading method, it has its strengths and weaknesses.
Let’s take a look at the pros and cons of using the ascending triangle pattern so you can make smart choices.
Pros:
- Bullish Signal: Ascending triangles are generally seen as bullish patterns. They indicate increasing buying pressure, suggesting that a breakout is likely. Traders often see this as a sign to enter a position before the price rises.
- Clear Entry and Exit Points: This pattern provides traders with well-defined entry points (just above the resistance line) and exit points (just below the support line). This clarity can help in managing risk effectively.
- Higher Probability of Success: Historically, ascending triangles have a higher chance of resulting in a successful breakout compared to other patterns. This can make them appealing to both novice and experienced traders.
Cons:
- False Breakouts: One of the main risks of trading ascending triangles is the potential for false breakouts. Sometimes the price can break above the resistance level only to fall back, leading to losses for traders who jumped in too quickly.
- Timing Issues: Identifying the perfect moment to enter or exit can be tricky. Traders may face challenges determining when to act, leading to missed opportunities or poor decisions.
- Market Conditions: The effectiveness of the ascending triangle can be influenced by broader market conditions. In a bearish market, even a strong ascending triangle might fail to yield the expected results.
Knowing the pros and cons of ascending triangles helps traders make better choices. Just like with any trading strategy, it’s important to use this information alongside other tools and insights for the best outcomes.
Ascending Triangle vs Rising Wedge
| Feature | Ascending Triangle | Rising Wedge |
| Overall Signal | Generally bullish and seen as a continuation pattern | Generally bearish and often signals a potential reversal |
| Trend Direction | Usually forms during an existing uptrend or consolidation before a breakout | Often forms during an uptrend but signals weakening momentum |
| Upper Trendline | Flat or horizontal resistance level | Sloping upward |
| Lower Trendline | Rising support with higher lows | Rising support, but converging with resistance |
| Price Structure | Higher lows pushing against a fixed resistance | Higher highs and higher lows with narrowing range |
| Buyer Behaviour | Buyers step in at increasingly higher prices | Buyers push prices higher but with decreasing strength |
| Seller Behaviour | Sellers defend a specific resistance level | Sellers gradually gain control as momentum fades |
| Volume Pattern | Volume often contracts before breakout and expands on breakout | Volume typically decreases as the pattern develops |
| Breakout Direction | Breakout usually occurs to the upside | Breakdown usually occurs to the downside |
| Trader Expectation | Continuation of the upward move after resistance is broken | Possible trend reversal or deeper correction |
| Risk Insight | Considered stronger when supported by high breakout volume | Considered a warning sign rather than a trend-confirming pattern |
Features Of Ascending Triangle Pattern
The ascending triangle pattern is a popular chart pattern used in technical analysis. It usually appears during an uptrend and signals that the price may break out upwards after a period of consolidation.
This pattern forms when a stock repeatedly hits a horizontal resistance level, while the support level keeps rising. As buyers gradually push the price higher, the trading range narrows and eventually leads to a breakout.
Some key features of the ascending triangle pattern include:
- Flat resistance line at the top where the price struggles to move higher
- Rising support line indicating increasing buying pressure
- Higher lows formed as buyers enter at progressively higher prices
- Breakout usually occurs above the resistance level
- Volume often increases during the breakout, confirming the trend
The pattern reflects a situation where buyers are becoming stronger than sellers, increasing the probability of an upward move.
How Does The Ascending Triangle Pattern Help Traders?
The ascending triangle pattern helps traders identify potential breakout opportunities. It signals that buyers are gaining control and may soon push the price above the resistance level.
Traders often watch this pattern to:
- Spot potential bullish breakouts
- Identify entry points before strong price movement
- Estimate price targets based on the triangle height
When the stock finally breaks above the resistance line with strong volume, it often indicates continuation of the upward trend.
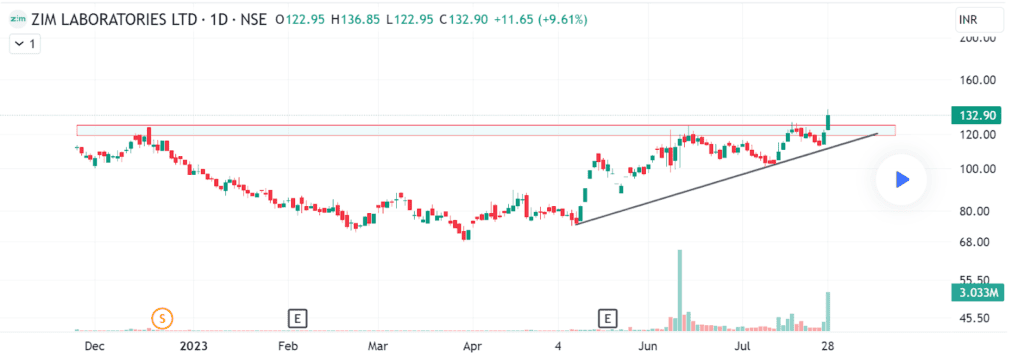
For example, if a stock repeatedly faces resistance near ₹500 but keeps forming higher lows like ₹470, ₹480, and ₹490, traders may expect a breakout above ₹500.
Characteristics Of The Ascending Triangle Pattern
The ascending triangle pattern has a few distinct characteristics that make it easy to recognise on a price chart.
Horizontal resistance level: The upper boundary of the triangle remains almost flat, indicating strong selling pressure at that price.
Rising support trendline: The lower boundary slopes upward as buyers gradually push the price higher.
Converging price range: The distance between support and resistance gradually narrows over time.
Volume contraction before breakout: Trading volume often decreases while the pattern forms and then spikes during the breakout.
Trend continuation pattern: Ascending triangles typically appear in an existing uptrend, signalling potential continuation of the trend.
These characteristics make the ascending triangle one of the most reliable bullish continuation patterns in technical analysis.
Trading Strategies For Ascending Triangle Patterns
Traders use several strategies when trading the ascending triangle pattern.
Breakout strategy: The most common strategy is to buy when the price breaks above the resistance level with strong volume. This confirms the bullish breakout.
Retest strategy: Sometimes the price breaks resistance and then briefly retests the breakout level before moving higher. Traders often enter during this retest.
Target price strategy: The potential price target is often calculated by measuring the height of the triangle and adding it to the breakout level.
Stop-loss placement: Traders usually place a stop-loss below the rising support line or below the last swing low to limit losses if the breakout fails.
Using proper risk management is essential because false breakouts can occur in volatile markets.
Conclusion
Trading the ascending triangle pattern requires a structured approach that includes careful entry points, exit strategies, and well-placed stop-loss orders. Remember that no trading strategy is foolproof and it’s crucial to combine technical analysis with proper risk management to improve your overall trading success. Continuous monitoring and adaptation to market conditions are important to stay ahead to win as a trader.
FAQ’s
A rising triangle pattern, also known as an ascending triangle, is a chart pattern where prices repeatedly face resistance at a similar level while the lows keep moving higher. This structure shows that buyers are becoming more confident and are stepping in at higher prices, often building pressure for a potential upward breakout.
Yes, an ascending triangle is generally considered bullish. It reflects increasing demand and buyer strength, especially when it forms during an existing uptrend. A strong breakout above the resistance level usually signals a continuation of the upward price movement.
A failed ascending triangle occurs when the price does not break above resistance and instead falls below the rising support line. This failure suggests that buyers have lost momentum, often leading to a downside move and trapping traders who were expecting a bullish breakout.
The price target for an ascending triangle is typically calculated by measuring the height of the triangle at its widest point and adding that distance to the breakout level. This method helps traders estimate potential upside and plan their entries and exits more effectively.
Yes, the ascending triangle is generally considered a bullish chart pattern. It shows that buyers are gradually gaining strength as prices form higher lows. When the price breaks above the resistance level, it often signals a potential upward price movement.
An ascending channel is usually bullish, as the price moves between upward-sloping support and resistance lines. However, traders watch closely for breakouts. If the price breaks below the lower trendline, it may signal a bearish reversal.