Candlestick charts are one of the most popular tools used in the technical analysis of stocks. The cup and handle is one such pattern formed on a candlestick chart that helps traders ascertain bullish trends in the market.
In this article, we will go through the details of the cup and handle chart pattern, including its formation and trading strategies.
What is a cup and handle pattern?
A cup and handle is a continuation pattern which gets formed during a bullish trend in its consolidation phase. It consists of a cup-like formation that gets formed right after an advance, followed by a handle. While the cup indicates a dip and rise in price leading to a U-formation, the handle indicates a dip in price before it rises again.
A consolidation phase refers to the period where the stock’s price moves within a limited range.
A price advance indicates a situation where the stock’s current high is more than the previous day’s high.
You may also like: Bullish engulfing candlestick pattern
Formation of the Cup and Handle Pattern on Charts
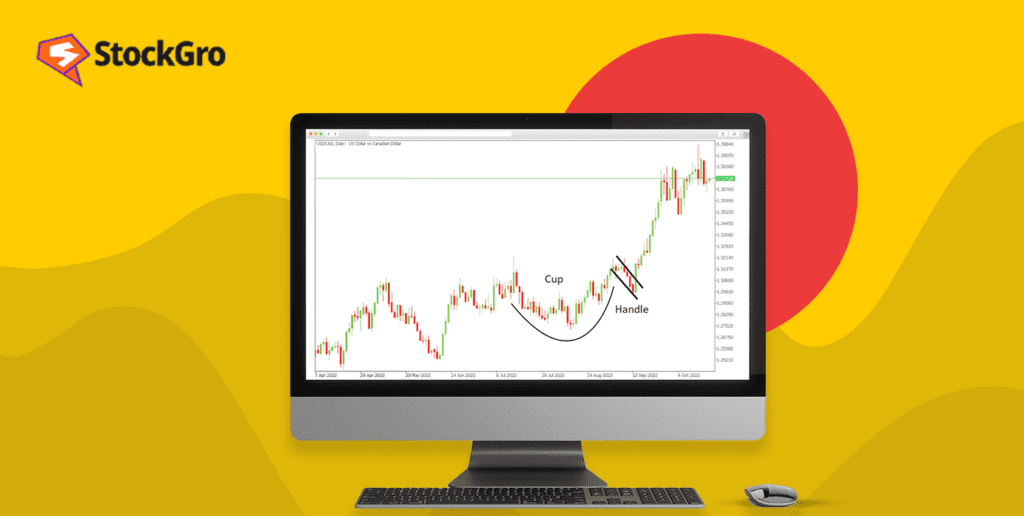
As the name suggests, the cup and handle pattern resembles a teacup. The pattern is usually formed after a bullish pattern where prices are increasing.
The price initially decreases up to a certain level, after which it stabilises. It then rises, generally to the same degree at which the prices fell.
While the falling and rising prices create the sides of the cup, the stabilised prices forms the U-shape at the bottom.
After the cup’s formation, the stock price either moves sideways or falls, leading to a handle formation. The handle can have a slight slope or a triangular pattern, depending on the price reduction. The length of the handle in an ideal scenario should not go below the cup’s middle point.
So, if the cup has prices between ₹96 and ₹100, the handle’s prices should not go below ₹98. If the price goes below that level, it may not be ideal to trade based on the cup and handle pattern.
Example
A recent example of a cup and handle pattern in the real world occurred in the candlestick chart of Shankara Building Products.
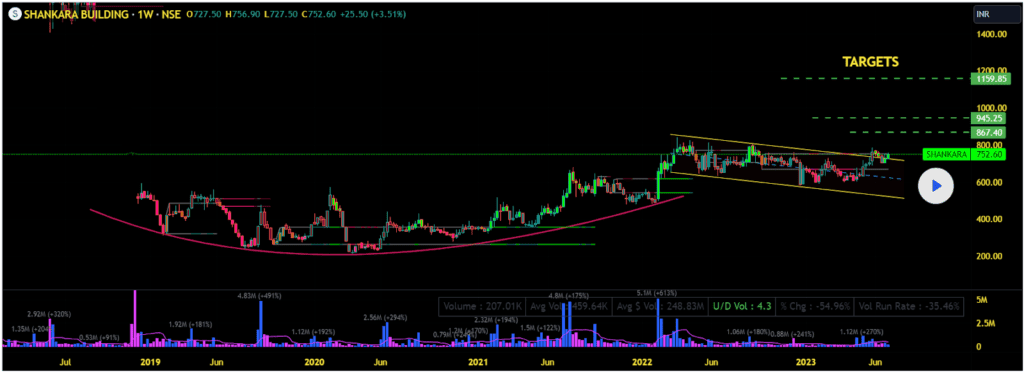
Source: Trading View
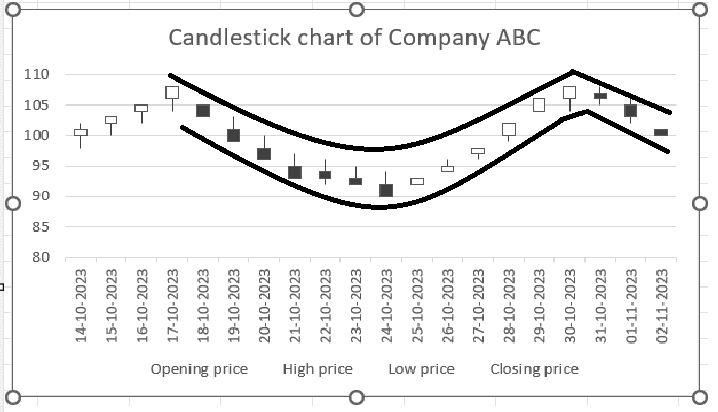
Consider the example of a hypothetical company ABC, whose stock is currently in an upward trend. Let us analyse the stock’s opening prices for a period of 20 days to understand the cup and handle pattern.
Starting from ₹100, the price increases until it reaches ₹106. It then starts dipping and goes down to ₹95. This forms the downtrend of the cup. The price then moves between ₹94 and ₹92 for close to a week, where the prices are almost stable, leading to a U-shaped bottom. It slowly starts increasing again, reaches an opening price of ₹106, and leads to the formation of the other end of the cup, indicating an uptrend.
The prices start dropping again, creating a handle pattern. The price of the cup has been moving between ₹92 and ₹106, which means that the handle shouldn’t go below ₹99.
Following the same, the handle stops at ₹100.
Also Read: Mastering the evening star trading pattern
Trading strategies
The cup and handle pattern is generally helpful while placing buy orders by bullish investors.
Entry level – Look for the handle’s resistance point, i.e., the highest price in the handle, after which it starts dropping. Place an order after prices break out from the pattern and rise above the handle’s resistance. The breakout may indicate that the prices will increase further since the cup and handle is a bullish continuation pattern.
Stop loss – The stop loss point is usually placed at the support level of the handle, i.e., the lowest price of the handle. Some traders who have a higher degree of risk tolerance place it at the support level of the cup, as well.
Target – Profit levels are determined based on the cup’s depth. Add the cup’s measurement (the cup’s range = highest price – lowest price point of the cup) to the handle’s breakout point to ascertain the target price.
Advantages and Disadvantages of the Cup and Handle Pattern
Benefits of the pattern:
- The cup and handle pattern clearly determines the entry, stop loss and target points, making it easy for investors to formulate their strategies.
- It provides different stop-loss points depending on the investor’s risk tolerance. So, for investors looking at low risk, it provides the right balance between risks and rewards.
- The cup and handle pattern is flexible and can be applied for different time frames.
Limitations of the pattern:
- Like every other technical indicator, the cup and handle chart can be a false alarm. Hence, it is always better when used with other tools.
- The pattern is more suitable for long-term than short-term analysis. In a short-term chart, the pattern may fail owing to external conditions in the economy.
Also Read: Discovering the secrets of the inverse head and shoulders pattern
Reverse cup and handle pattern
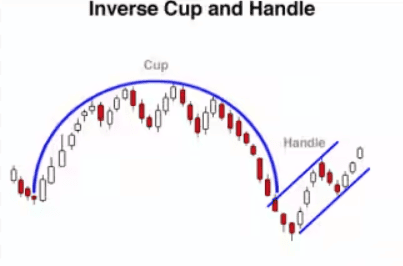
As the name suggests, the reverse cup and handle pattern is the opposite of the usual cup and handle pattern. Also called the inverted cup and handle pattern, this indicates a bearish continuation pattern.
The market is initially bearish, after which it rises, stabilises and falls again. It again rises slightly to form the handle and then breaks out of the pattern to continue its bearish trend.
Bottomline
The cup and handle pattern is a significant tool for bullish traders and helps in the technical analysis of stocks. It forms during a bullish continuation with a minor setback where prices start falling. It helps formulate trading strategies in such scenarios, however, traders should use different technical indicators together for the best results.
FAQs
What does a Cup and Handle pattern signify?
It indicates a bullish continuation, where the price forms a “cup” shape followed by a smaller consolidation, the “handle,” before breaking above resistance, signaling a potential rise.
How reliable is the Cup and Handle pattern for trading?
Research clearly shows that the success rate is always high, where some studies suggest as high as 95% accuracy in bull markets leading to large price appreciation.
How long does it take for a Cup and Handle pattern to form?
The cup is generally completed in 1 to 6 months, while the handle remains for 1 to 4 weeks, but these terms can be different.
Can the Cup and Handle pattern be used for different time frames?
Yes, it is seen in almost all time frames from intraday to weekly, but is most consistent with the daily charts that span over a number of weeks.
What are the key factors that determine the success of a Cup and Handle pattern?
Key factors include a well-formed, rounded cup, a handle that retraces no more than 33% of the cup’s advance, and a breakout accompanied by increased volume.