Let’s take a moment to admire the subtle yet powerful language of the market – the world of candlestick patterns. Amidst the vast lexicon of candles, there’s one pattern that stands out, evoking intrigue and excitement – the Doji candle.
Whether you’re new to the financial market scene or just curious about this captivating candlestick, you’ve landed in the right place. We’re about to dive deep into the world of the doji candlestick pattern.
Understanding the Doji candle
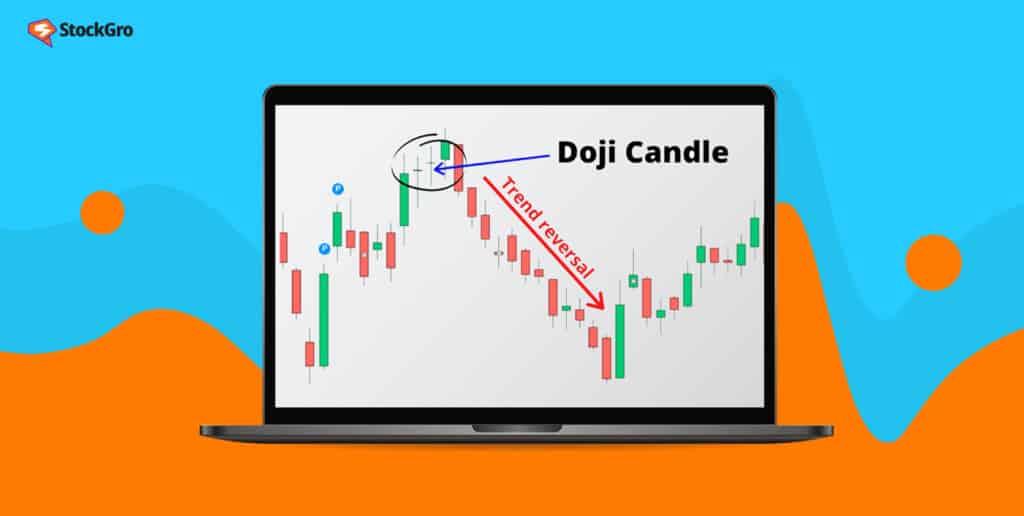
Doji candles are a basic candlestick pattern that encapsulates a fascinating aspect of market psychology. They symbolize a session where neither the buyers nor the sellers gain the upper hand, leading to a near-identical opening and closing price for that specific period.
In essence, a doji candle reveals a market scenario where both parties have fought a battle but reached a stalemate, effectively saying, “This round is a draw!”
You may also like: How do traders harness the power of Hammer Candlestick patterns?
The different faces of the Doji candlestick pattern
Though the core essence of a doji remains the same, it has various avatars or types, each telling its own tale.
- Classic Doji: This is the purest form of the Doji candlestick. Here, the opening and closing prices are the same. The wicks (lines above and below the candle body) can be long or short, suggesting the price range during that period.
- Long-legged Doji: Imagine a doji that went on an adventure, exploring both the highs and lows of the market. That’s the long-legged Doji for you. It has longer wicks, indicating a wider trading range and greater indecision among traders.
- Dragonfly and gravestone Doji: Both these doji candlestick types are special. The dragonfly has a long lower wick and no upper wick, indicating sellers pushed the prices down, but buyers managed to pull it back up to the opening price.
On the other hand, the gravestone doji is the opposite. It showcases a session where buyers took the price up, but sellers came back with a vengeance, bringing it back to where it started.
The significance of the Doji pattern
Whenever a doji appears on a chart, traders sit up and take notice. Why? Because the doji pattern signals indecision. It’s the market’s way of saying, “I’m not sure where to go next.” But it’s this very indecision that makes the doji a potentially powerful indicator.
- Reversal signal: Often, when a trend has been running for a while, be it upwards or downwards, a doji can indicate a potential change in direction. It’s like the calm before a storm.
- Continuation signal: Sometimes, the doji simply means a brief pause instead of signalling a reversal. The trend may continue in the same direction after this short break.
Remember, while the doji pattern can be a critical indicator, it’s always best used in conjunction with other tools and methods. No single pattern or tool can offer a guaranteed prediction.
Also Read: An essential guide to shares – types & significance
Floating candles versus Doji candles
While exploring candlestick patterns, you might come across something called floating candles. It’s essential not to confuse these with doji candles.
Floating candles are often seen in decorative settings, such as serene pools or romantic dinner tables, whereas doji candles are strictly a stock market phenomenon. Both have their own beauty and place, but it’s crucial not to mix the two!
Reading the Doji in different market scenarios
It’s one thing to recognize the doji candlestick pattern and quite another to interpret its implications in diverse market situations. For those getting started, here’s a handy guide to understanding what a Doji could mean in various scenarios.
Interpreting the Doji candlestick pattern
| Market Situation | Appearance of Doji | Potential Interpretation |
| Uptrend | Classic Doji | Possible trend reversal. The market might indicate a downturn or a brief period of consolidation before continuing upwards. |
| Downtrend | Dragonfly Doji | Strong reversal signal upwards. Sellers tried to dominate, but buyers made a comeback. |
| Uptrend | Gravestone Doji | Potential bearish reversal. The buyers tried to push the market higher, but the sellers pulled it back down, indicating their strength. |
| Sideways Market | Long-legged Doji | Strong indecision. The market is undecided on which direction to take, suggesting a significant move might be on the horizon once a decision is made. |
Bringing other factors into play
Although the Doji candlestick types can be a reliable indicator of market sentiment, they’re most potent when combined with other technical factors. These can be other candlestick patterns, technical indicators, or even just support and resistance areas.
- Volume: Volume is a great companion to the doji pattern. A doji with a significantly high trading volume can indicate a strong sentiment for a potential reversal or continuation.
- Support and resistance: A doji can offer even more valuable insight if it forms near known support or resistance levels. For instance, a dragonfly doji near a support level in a downtrend could be a strong bullish reversal signal.
Also Read: Essential guide to candlestick patterns for beginners
Busting a common myth about doji candlestick pattern
Many beginners believe that every doji they spot is a sign of a market reversal. This isn’t always the case. Sometimes, a doji merely indicates a pause in the ongoing trend, after which the trend resumes.
It’s vital to consider the broader context. What’s happening in the wider market? What are other technical indicators saying? Answers to these questions can provide more clarity.
Final words
The doji candle, with its many avatars, holds a mirror to the market’s soul. It tells tales of battles between bulls and bears, of days when neither side could claim victory.
As you begin or continue your trading journey, let the doji be a reminder. It is a reminder that the market, like life, has moments of certainty and indecision. And it’s in understanding these subtle cues that you can truly become a master of the game. Happy trading!