Stock market movements seem chaotic. If you can bring even a smidgen of certainty to this uncertain scenario and predict trend reversals and price movements, your pockets will be flush with returns. Identifying specific patterns using technical analysis can aid you in this process. But what is technical analysis? And what is the double bottom pattern or the much talked about w pattern in the chart, and what does it mean for you as a trader?
Read on to find out.
What is technical analysis?
If you wish to analyse a stock before purchasing it, there are two types of analyses that you may conduct- fundamental and technical analysis. Fundamental analysis tries to find the ‘fair market price’ of a stock based on company financials. On the other hand, technical analysis involves figuring out the future price movements of a stock based on its past performance in terms of price and volume traded.
You may also like: Unlocking the power of preference shares
What is a double bottom pattern?
In technical analysis, different types of patterns are found in the price charts of stocks. Certain patterns are indicative of a price rise/drop. The double bottom pattern is one such pattern. A double bottom pattern is observed when the price moves so that the candlesticks form a ‘W’ shape.
How to spot a double bottom pattern?
Look for the following signs while identifying a double bottom pattern:
- Pattern
In a double bottom pattern, you will be able to observe two troughs or bottoms of approximately the same height with a peak or high point in between.
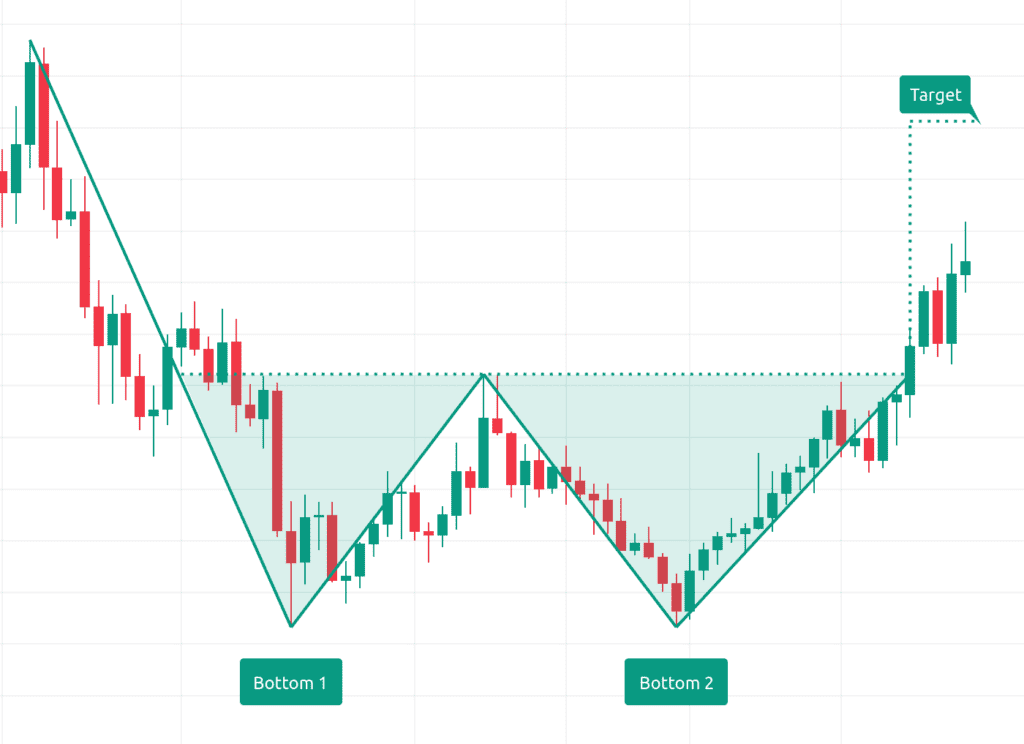
The troughs need not be identical but must ideally be within 3-4% of each other. These together will look like the letter W. It is essential to ensure that the time between the two troughs is not too long, as that could imply that the bullish trend reversal is not gaining momentum.
- Previous downtrend
A relatively long period of a downtrend (during which the price keeps falling) precedes a double bottom pattern. The downtrend is crucial for the possibility of an uptrend after the pattern.
- Volume
Tracking volume during the pattern’s formation can help you assess if there will be an uptrend after the double bottom pattern. Ideally, trading volumes should be high when the first bottom is formed. A decrease in trading volume should follow when the peak is formed. Then again, trading volume should increase during the formation of the second trough, and the volume during the second trough should ideally be higher than during the first.
- Neckline
Draw a straight line across the peak, as shown in the image below. It is known as the neckline. If the stock price rises above the neckline level, it can be taken as a sign that a double bottom pattern has formed, and there is a chance for a price reve₹al from downtrend to uptrend.
Image: Double bottom chart pattern. In this image, the line on top is the ‘neckline.’
- The time between the troughs
The word ‘timeframe’ in this context refers to the duration between the formation of the first trough and the second one. The shorter the timeframe, the more the likelihood of a reversal toward an upward trend.
Also read: An exploration of secondary market dynamics
Interpretation and double bottom pattern trading
- Stop Loss Identification
When you observe a w pattern stock, you might still be unsure if the uptrend will happen. To protect themselves from this uncertainty, most traders will place a stop-loss. A stop-loss is a command given by traders wherein, after hitting a particular price, the stock is sold automatically.
For instance, imagine that you expect the price of a stock you hold to rise to ₹75. However, you are uncertain if there will be an uptrend. So, you place a stop-loss at the ₹65 mark. Now, contrary to your expectations, there is a downtrend. The moment the stock price hits the ₹65 mark, it will automatically get sold.
Stop-loss is essential as it prevents you from incurring massive losses and shields you from loss aversion bias.
A double bottom pattern hints about where to place a stop loss. Ideally, traders place the stop-loss at the bottom of the second trough. It is an ideal point because if there is a trend reversal, you get the returns, but if the price falls below the second trough, it automatically implies that there will be no trend reversal, and you can cut your losses immediately.
- Target Price Determination
Now you know that stop-loss is the lower limit for a stock’s price. Similarly, the target price is the upper limit. If you estimate that the target price is ₹150, it implies you do not expect the price of this stock to go beyond ₹150.
The w pattern trading also helps us to estimate the target price that you should go for. You can calculate the target price using this pattern with the following steps:
- Check the lowest price point during both troughs and mark that price as Point A.
- Check the highest price point during the peak and mark that point as Point B.
- Calculate the distance from Point A to B.
- Consider the exact price point at which the stock’s price has gone above the neckline and add the distance between A and B to that point. The result is your new target price and an estimate of how much the stock’s price will increase.
Also read: What is the strangle option strategy?
Example of double bottom pattern
Now let us understand all the concepts using a simple example:
Let us consider the recent candlestick price chart of Power Grid Corporation.
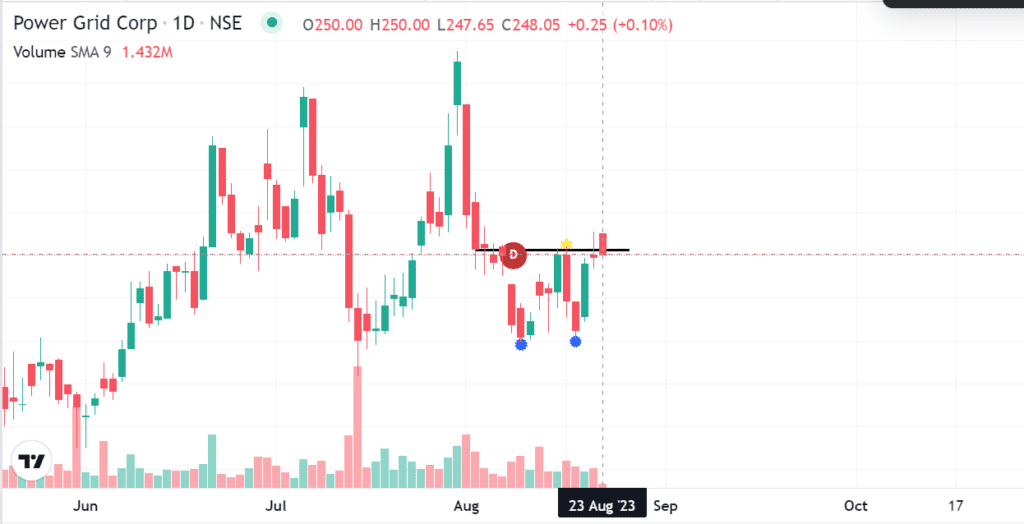
Here, the two blue dots indicate the bottom of both troughs, and the yellow dot is the peak. The black line drawn across the peak point is the neckline. As can be seen, on 23rd August, the stock price went above the neckline and may continue rising.
Now you can measure the distance between the lowest point on both troughs and the peak as shown in the picture:
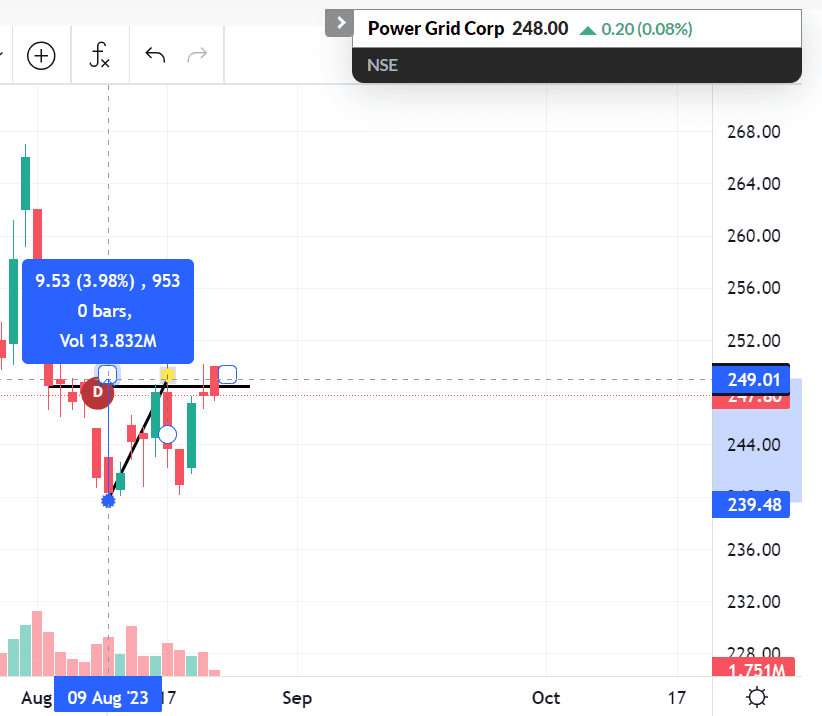
As you can see, the distance between the points is calculated to be around ₹9.53.
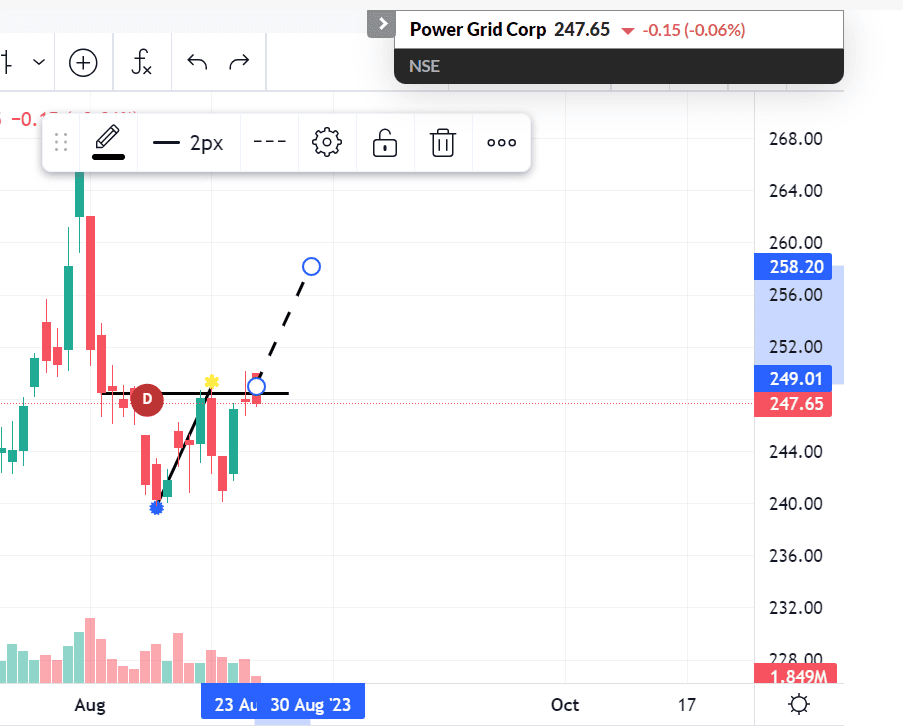
So, from the breakout point on 23rd August, you can estimate that the price has the potential to increase up to ₹258.20 or higher as shown below-
Conclusion
To summarise it all, learning to identify different patterns can help you become a seasoned trader and earn returns using your technical skills. However, you should not use the double bottom pattern in isolation. You may look at other technical analysis indicator like Bollinger bands, Relative Strength Index (RSI), Moving Average Convergence/Divergence (MACD), etc., and also at fundamental analysis so that you can pick the right stock for your portfolio.