Analysing stock charts is an integral part of trading and investment strategies. Over time, various methods have been honed to interpret market dynamics.
Among these, price reversal patterns stand out as critical tools for investors, indicating probable shifts from an existing trend to a new one. When a stock’s price transitions from an uptrend to a potential downtrend, these formations serve as a red flag for market participants.
Today’s focus is on the double top pattern, a classic example of a price reversal indicator, which we will explore in detail. Keep reading to learn more.
You may also like: A comprehensive guide to reversal candlestick patterns
What is double top pattern?
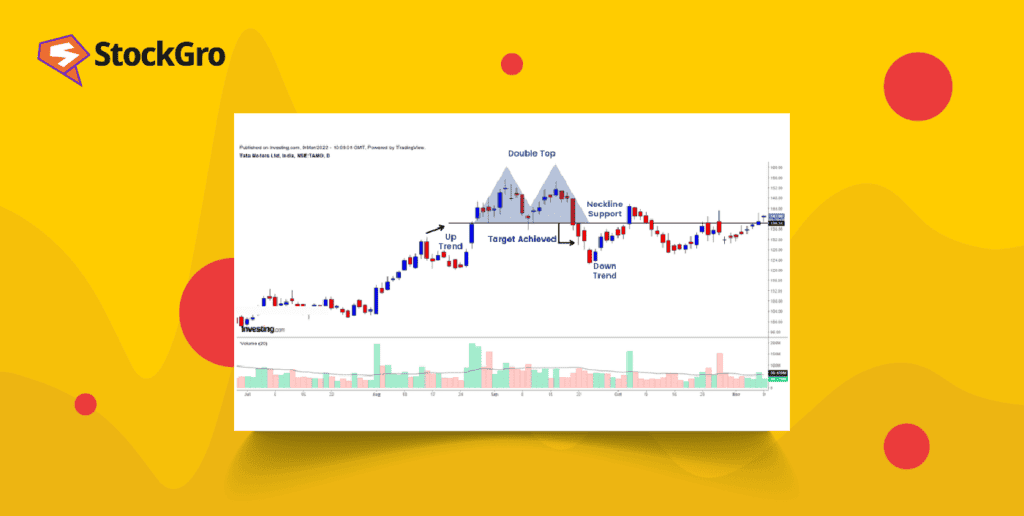
The double-top pattern is a bearish technical reversal configuration. It resembles the letter ‘M’ with two prominent peaks at approximately equal highs, separated by a trough.
After the first peak, there’s a pullback to a support level known as the ‘neckline,’ followed by a rise to the second peak, mirroring the first in height.
Completion and confirmation of this bearish reversal signal occur when the price drops below the neckline after the formation of the second peak. The lowest low is called the ‘confirmation point’. This pattern is a significant indicator for traders anticipating the start of a downtrend to position their trades accordingly.
How to identify the double top pattern?
Identifying a double top pattern involves a few clear steps.
- Spot an uptrend: Begin by ensuring that the stock is in an established uptrend. This is essential because the double top is a reversal pattern that appears after an advance.
- First peak: Look for the first peak, which is the high point of the current trend. This peak is the initial sign of potential resistance where the price stops rising.
- Trough formation: After the first peak, the price will dip, forming a trough. This represents a temporary pullback or consolidation in the price.
- Second peak: The price then attempts a second rise towards the level of the first peak but fails to break through this high, signalling that the market may not have enough buying pressure to continue the trend.
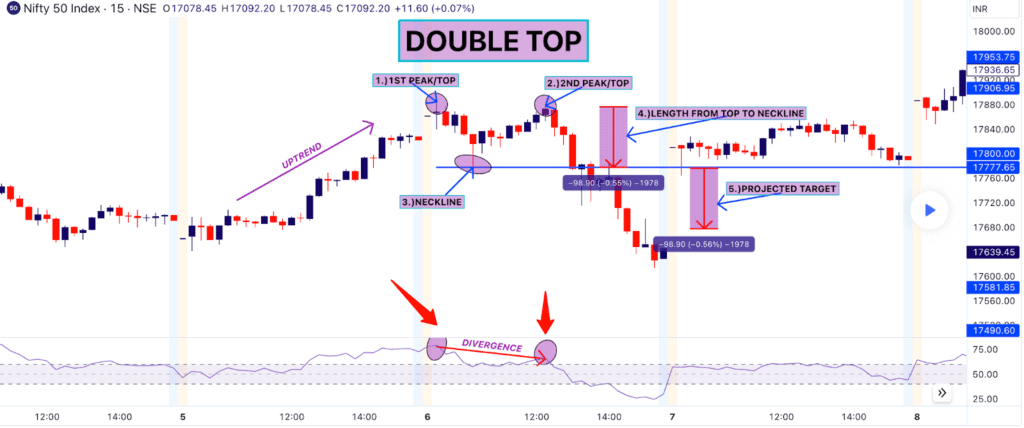
- Neckline drawn: Connect the lowest points of the pullback between the two peaks with a straight line. This line is called the neckline and acts as a support level.
- Confirmation: Confirmation of the pattern happens when the price falls below the neckline after forming the second peak. A drop below the neckline confirms that the pattern is in place and suggests a potential sell-off ahead.
By following these steps, traders can pinpoint double top formations and make informed decisions about potential price movements.
Also read: Understanding double bottom pattern
Practical considerations
When analysing a double top formation for trading, it is important to carefully consider the following aspects:
- Broader trend: A double top pattern is a bearish reversal pattern that is only considered valid if it occurs after a sustained bullish trend, say for three months. This requirement ensures that the pattern represents a significant shift in market sentiment rather than a minor fluctuation.
- Pattern features:
- Height and depth: The pattern consists of two peaks that are roughly around the same price level, with a low in between.
- Width between tops: The time between the two tops should be significant to allow for clear identification and to avoid mistaking normal price volatility for a pattern.
- Volume considerations: Volume plays a crucial role in confirming the pattern. Typically, the volume is higher at the first peak and lower at the second, indicating weakening momentum in the trend. If volume increases at the second peak, it may suggest that the trend is still strong, and a reversal is less likely.
Advantages of double top chart pattern
- Clear signals: It offers distinct signals for trend reversals, making it a reliable indicator for when buying pressure is weakening.
- Defined strategy: Provides specific entry and exit points, aiding traders in risk management by setting stop-loss orders just above the second peak.
- Pattern recognition: The pattern is visually distinctive and can be spotted easily on candlestick charts.
- Applicability: It is versatile and applicable across different time frames and asset classes, including stocks, indices, commodities, and currencies.
- Technical analysis synergy: When combined with other technical analysis tools like moving averages or oscillators, it can enhance the accuracy of reversal signals.
Disadvantages of double top candlestick pattern
- False signals: It can occasionally give false signals, leading traders to anticipate a change in trend that doesn’t materialise.
- Subjectivity: Identifying this pattern can be subjective; not all traders may agree on its presence, as the peaks and troughs may not always be perfectly formed or symmetrical.
- Timing challenges: Deciding the optimal moment to act on a double top pattern can be tricky. Mistiming can lead to financial losses.
- Market strength overpower: In a strong uptrend, the pattern may give a false signal, suggesting a reversal that does not actually occur.
- Pattern overlap: It can sometimes be confused with other chart patterns, complicating the interpretation.
Also Read: Essential guide to candlestick patterns for beginners
Difference between double top and double bottom pattern
The double top and double bottom patterns are both popular chart patterns used in technical analysis, but they signal opposite market trends and potential price movements. Here are the differences.
| Feature | Double Top Pattern | Double Bottom Pattern |
| Trend indication | Bearish reversal (end of uptrend) | Bullish reversal (end of downtrend) |
| Shape | “M” shape | “W” shape |
| Market sentiment | Indicates buyers are losing control | Indicates sellers are losing control |
| Confirmation | Price falls below support level (trough) | Price breaks above resistance level (peak) |
| Price movement | Two peaks at similar levels | Two troughs at similar levels |
| Trading strategy | Consider selling or taking short positions | Consider buying or taking long positions |
| Volume pattern | Volume may decrease at second peak | Volume may increase at second trough |
| Sentiment shift | From bullish to bearish | From bearish to bullish |
| Chart appearance | After an uptrend | After a downtrend |
| Predicts | Potential downward movement | Potential upward movement |
Bottomline
The double top stock pattern is a powerful indicator for identifying potential bearish reversals following a sustained bullish trend. However, it’s important to note that not every pattern will be perfect, and some subjectivity is involved in pattern identification. Hence, looking for additional confirmation through volume changes or other technical indicators can provide further validation of the pattern.