The Dow theory, also referred to as the Dow Jones theory at times, was founded by Charles Dow in the 1990s. He published the theory in parts in The Wall Street Journal, which became prominent after his death when other editors of the journal compiled all the theories together.
One of the early theories in the stock market world, the Dow theory, is said to be the pioneer of uptrend and downtrend concepts in the stock market that help in analysing the price movement of stocks.
What is the Dow theory?
Dow theory in technical analysis uses stock market indices to determine the market’s movements.
It believes the market is in an uptrend if an index breaks the resistance level and moves upward, followed by another index following the same pattern. Both price and volume are tracked for the Dow theory analysis.
Understand the workings of Dow theory.
Below are the 6 principles of Dow theory:
The market discounts everything.
The primary principle works on the efficient market hypothesis. It suggests that a stock’s market price is a mirror of all its past and present trends.
It is believed that the movement of share prices suggests everything about a stock’s behaviour and is one of the critical parameters for investors to study the market.
The hypothesis works on the idea that stock prices and stock market indices are extremely volatile. So, the stock prices and indices react rapidly to any unforeseen event that occurs in the market.
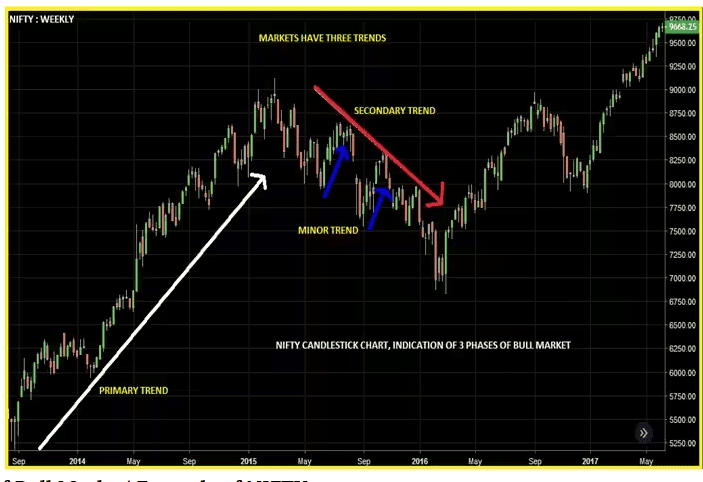
The three market trends.
According to this principle, the market moves in three different trends.
Source: Moneycontrol
- Primary trend: This is the dominant market trend. It suggests whether the market is bullish or bearish. Retail investors in the stock market generally keep track of the primary trend to move in the same direction to benefit from stock price movements. These trends are usually long-lasting.
- Secondary trend: The secondary trend is a short-term corrective action. These trends move against the dominant trend. In a long-term bullish market, the secondary trend is bearish for a few weeks until the market picks up again, and vice versa.
- Minor trend: Minor trend, as the name suggests is minor, meaning it lasts for a very short period, generally less than one day. These trends are unreliable as the movement is based on market rumours.
- The three market phases
According to the Dow theory, both upward and downward market trends go through three different phases, where they form the support and resistance levels.
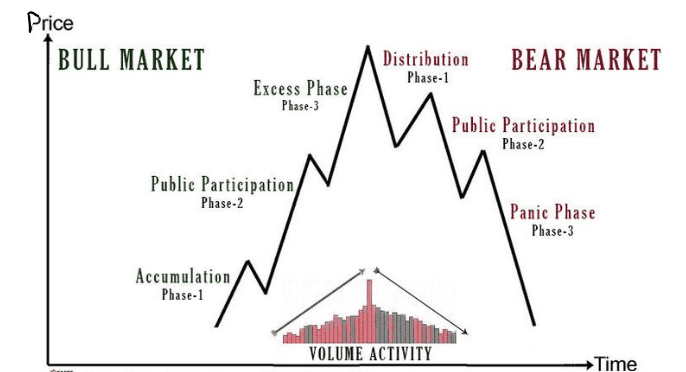
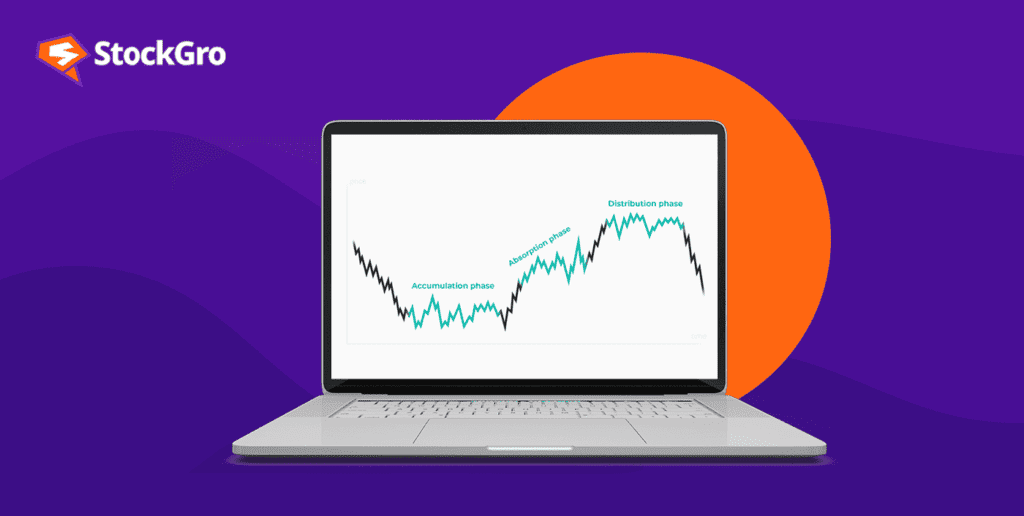
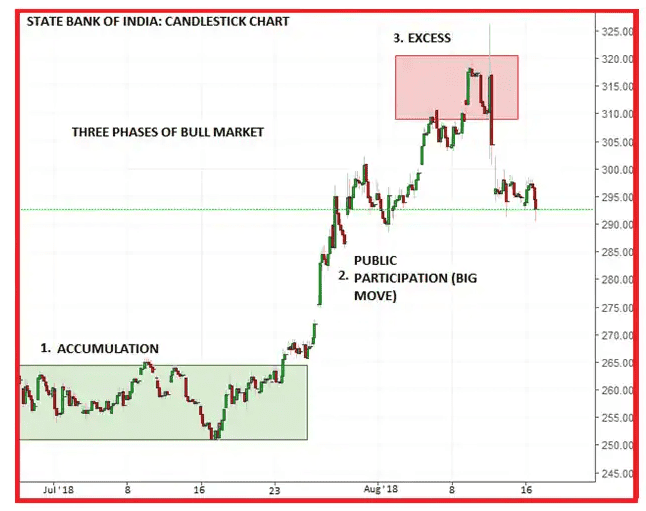
Phase 1: The accumulation phase
In this phase, the stock prices reach their lowest points. Despite the low prices, investors don’t invest in these stocks as they doubt the stock’s capability to perform well. So, the stock continues to stay at low prices.
At this point, large investors enter the market to create a support level. They buy the stocks in multiple quantities to create a demand for them and thereby increase the stock’s price.
Source: Moneycontrol
Phase 2: The phase of public participation
Once the retail investors notice the increasing stock price, they develop confidence in the stock’s performance and invest in it.
The increase in demand leads to the stock’s price rising further, and the bearish market starts getting bullish. The stock’s performance continues to attract more investors until the price reaches its peak.
Phase 3: The distribution phase
Also called the excess phase, this phase is the opposite of accumulation. At this juncture, where the prices are at their maximum, investors enter the market to sell their shares.
The selling of shares leads to an increase in supply, causing a reduction in prices and creating a resistance level. The reducing trend marks the beginning of a bear market again.
Indices must follow each other.
The next principle of the Dow theory states that all stock market indices must follow each other to ascertain a market trend. For example, if SENSEX shows an upward trend, NIFTY should project the same pattern, too. Otherwise, it may not be an accurate indication of an upward market.
Also read: Difference between Nifty and Sensex
Price and volumes must move together.
This principle states that the price and volume must have a coordinated movement. The volume of a stock must follow its primary market trend and move in the corresponding direction.
In a bullish market, price and volume must move upward together. In a market that is primarily bearish, the volume must increase as the price reduces. It basically suggests that the increase in volume must be based on the primary trend and not the secondary trend.
Secondary trends are not reversals.
The secondary trend, as per the Dow theory, moves in the opposite direction of the primary trend, looking like a reversal. Charles Dow suggests that the market should be assessed based on the primary trend unless there is a clear indication of a reversal.
The relevance of Dow theory
Though the theory was formed over a century ago, it is still considered relevant in today’s stock market, as most investors prefer trading in the direction of the stock.
Since the theory uses a long-term perspective to analyse market trends and lays out the principles to follow during analysis, it is said to be easy and beneficial for investors.
Despite the benefits, the Dow theory is subject to criticism as investors feel that the theory does not consider a broad approach to analyse market movements.
Market movements may depend on various external factors like political and economic situations. Hence, judging the market’s future movement based on past trends alone may not always be accurate.
Also read: Do all technical analysis tools work equally well?
Bottomline
The Dow theory is one of the significant indicators for the technical analysis of the stock market. It is generally considered an accurate tool that determines past trends of a stock.
However, it is always better for investors to combine this tool with other technical indicators that provide an all-around picture of the market to analyse the future movements of stocks.
Further reading: Essential guide to candlestick patterns for beginners