Welcome to our exploration of the evening star pattern, an important key for studying technical analysis. In the intricate world of candlestick charting, the evening star emerges as a signal of potential trend reversals.
Join us as we decipher this three-candlestick pattern, uncover its nuances, and learn how to wield it effectively in your trading endeavours. Discover the Most Powerful Candlesticks Patterns for Trading.
Evening Star Candlestick Pattern Meaning
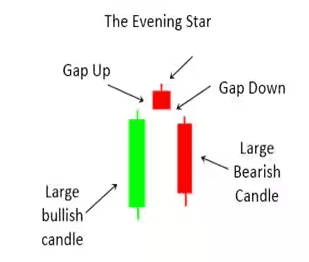
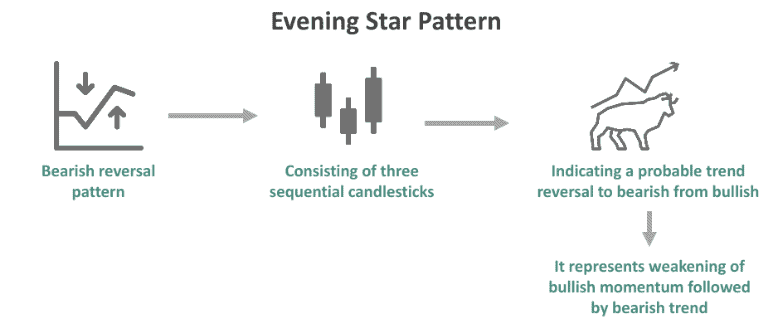
The evening star is a bearish candlestick pattern in technical analysis, signifying a potential trend reversal in financial markets. It has three types of candles.
Source: Money Control
First, a large bullish candle reflects an ongoing uptrend. Second, a small indecisive or doji candle illustrates market uncertainty. Finally, a large bearish candle appears, suggesting a potential trend reversal, with the price closing significantly lower than the previous candle.
The evening star pattern signifies a shift from bullish sentiment to bearish sentiment, serving as a warning for traders to consider selling or taking protective measures as market dynamics may be changing.
The Evening Star pattern has been proven to be most effective when it forms after a long uptrend or at significant resistance levels, which increases the chances of reversal.
Technical analysts often use this pattern alongside other indicators or patterns like volume, moving averages, and oscillators such as the Relative Strength Index (RSI) to determine its validity.
Moreover, high trading volume on the bearish candle should mean even more selling pressure. At the same time, traders may look for gaps between the Doji candle and the bearish candle to act as added confirmation.
In risk management, stop-loss orders are typically placed just above the high of the evening star formation to limit potential losses if the market continues to rise unexpectedly.
Also read: Candlestick patterns
Components of evening star pattern
First candle (Bullish):
The pattern typically begins with a large bullish candle, representing an existing uptrend. This candle suggests buyers have control, and the asset’s price is rising.
Second candle (Indecision):
Following the bullish candle, a small-bodied candle with a narrow trading range appears. This second candle signifies market indecision and reflects a potential shift in sentiment.
Third candle (Bearish):
The evening star pattern concludes with a big candle indicating a bear pattern. This candle starts with an opening price that is lower than the second candle’s closing price and ends with a price that is noticeably lower than the first candle’s closing price. The strong bearish candle indicates control by the sellers leading to a reversal.
Price gaps:
Price gaps between candles can enhance the pattern’s significance. The distance between the second and third candles strengthens the bearish signal.
Volume considerations:
While not a strict component, monitoring the size of trading provides conformity. An increase in the size of the bearish candle reinforces that the evening star is reliable.
Candlestick shapes:
Variations in candlestick shapes within the pattern can offer subtle insights. For instance doji or spinning top in the second candle underscores market indecision.
Also read: Candlestick reversal patterns
Interpreting the evening star candle
Source: Wall Street Mojo
Recognition and confirmation:
Identify the evening star by looking for a sequence of three candles: a large bullish candle (1), followed by a small indecisive or doji candle (2), and finally a large bearish candle (3).
The pattern is most reliable after a sustained uptrend, suggesting a potential reversal in market sentiment.
Bearish reversal signal:
The evening star pattern represents a shift in the sentiment. The first bullish candle indicates prior optimism, but the small second candle signifies uncertainty or a loss of bullish momentum. The third bearish candle affirms the reversal by initiating with an opening lower than the second candle’s close and concluding notably below the closing price of the first candle.
Implications for traders:
When the evening star pattern is confirmed, traders often interpret it as a signal to consider selling or taking protective measures. It suggests that sellers are gaining control, and the asset’s price may decline in the near future.
Confirmation factors:
While the evening star pattern alone is significant, traders often seek additional confirmation through technical indicators, volume analysis, or trendline breaks to enhance the pattern’s reliability.
Stop-loss and take-profit levels:
Stop-loss orders are frequently placed by traders above the high of the third bearish candle to reduce possible losses if the reversal signal is unsuccessful. Profit levels are determined based on the support/resistance levels and with the help of other technical indicators.
Evening star candlestick example
Let’s understand the evening star candlestick pattern through a real-world example by studying the technical chart of Asian Paints Ltd.
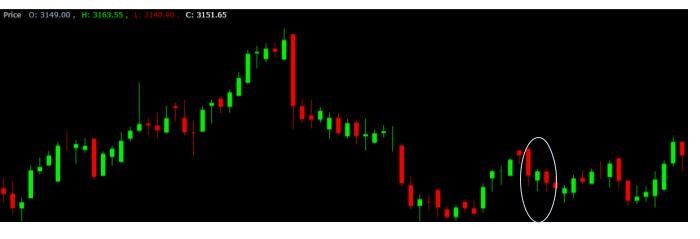
Source: BSE
- Day 1 witnessed a substantial bullish candle.
- Day 2 saw the formation of a relatively small bearish or bullish candlestick.
- Day 3 featured a significant bearish candlestick.
Notably, there exists a gap between the bullish candle of day one and the bearish or bullish candle of day two. There is a downward gap between the bearish candle of day three and the subsequent bullish or bearish candlestick of day two.
In this specific instance, the price momentum shifted clearly from a bullish to a bearish trend. The large bullish candle on day 1 indicates strong buying pressure, with investors pushing the price higher.
On day 2, however, the small candlestick reflects indecision in the market, as traders begin to lose confidence in the bullish trend. By day 3, the seller’s gain control, resulting in a large bearish candle, marking the start of a reversal in the stock’s upward trajectory.
The gaps between these candles further emphasize the strength of the reversal, as they showcase a lack of upward momentum and a sudden influx of selling activity. This clear shift is often regarded as a strong indicator that a downtrend is likely to follow.
Traders usually consider entering short positions when this pattern is confirmed, especially if the volume is higher on day 3.
Also read: Bullish engulfing pattern
Morning Star VS Evening Star Candlestick Pattern
| Evening star pattern | Morning star pattern |
| Signals an uptrend to a downtrend. | Shows from the trend downwards to upwards. |
| Comprises three candles – bullish, indecisive, and bearish. | Consists of three candles – bearish, indecisive (often a doji), and bullish. |
| Starts with a large bullish candle. | Begins with a large bearish candle. |
| Features a small indecisive or doji candle. | Often includes a small indecisive or doji. |
| Concludes with a large bearish candle. | Ends with a large bullish candle. |
| Warns of potential bearish sentiment and a forthcoming downtrend. | Suggests a potential bullish sentiment and an emerging uptrend. |
| Requires confirmation from subsequent bearish price action. | Requires confirmation from subsequent bullish price action. |
| Shows a market shift from optimism to pessimism. | Represents a shift from market pessimism to optimism. |
| Traders often consider selling or implementing protective strategies. | Traders frequently seek buying opportunities or anticipate trend reversals. |
| Appears at the end of an uptrend. | Occurs at the conclusion of a downtrend. |
Bottomline
In summary, interpreting the evening star trading pattern involves recognizing the three-candle sequence, understanding its bearish reversal signal, and using additional confirmation and risk management techniques to make informed trading decisions.
To effectively trade using the evening star pattern, traders should combine it with other technical analysis tools such as support and resistance levels, volume analysis, and momentum indicators like the RSI (Relative Strength Index). These additional tools help confirm the strength of the reversal and avoid false signals.
Moreover, risk management strategies like setting stop-loss orders just above the third candle’s high or using a trailing stop can help protect against potential losses in case the market moves unexpectedly. It’s also crucial to assess the broader market trend and avoid relying solely on the evening star pattern in isolation.
Incorporating these extra steps can help traders increase the accuracy of their trades and improve their overall success rate in bearish market conditions.
Learn to understand the Rising Three Method on a five-candle sequence.
It serves as a valuable instrument for traders aiming to detect possible shifts in trends and adapt their strategies accordingly.