
Have you noticed repetitive patterns in stock charts? They’re called flag patterns and are more than just designs. They help predict where prices might go next.
By acting as brief pauses, they signal that an existing trend may carry on. For traders, they’re like guiding stars, to identify and capitalise on the market waves, to get better returns. Curious? Read on to uncover their power.
What are flag patterns?
Stock charts are visual tools used to track the price of stocks over time. They offer traders insights into market trends and potential future price movements. One such insight is the flag patterns, a specific formation that stands out after significant price shifts.
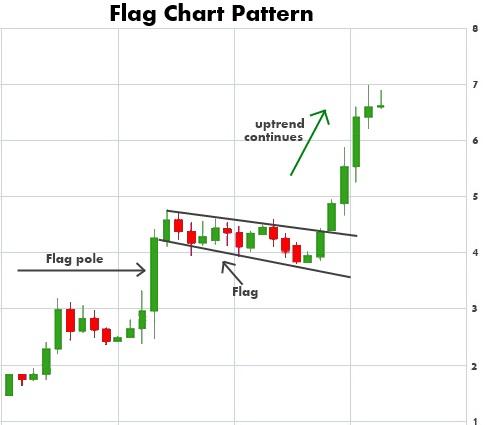
When there’s a sudden jump or drop in stock prices, the market doesn’t always keep up the pace. It might take a short break, moving within a limited range. This momentary halt is what we term a flag patterns.
There are two primary types of flags: bullish and bearish. A bullish flag chart pattern hints that the stock prices might go up, while a bearish flag suggests a possible decline. But these aren’t prolonged patterns; they typically show up over short durations, ranging between five to 15 price bars.
One standout feature of flag patterns stock is its high risk-to-reward ratio. For traders, this implies the possibility of gaining substantial returns for a relatively minor risk.
To spot a flag patterns, watch out for these five elements:
- A strong price movement before the flag (the ‘pole’).
- The little pause moment (the ‘flag’).
- The pattern of trades happening during this pause.
- A sudden move in prices (breakout).
- A sign that prices are back to moving like they did before the pause.
However, it’s crucial to remember flag patterns are only a part of technical analysis. Combine other tools to ensure a holistic approach to stock trading.
Different Types of Flag Patterns
The classification of Flag patterns is made regarding the prevailing trend as well as the direction in which the consolidation period is oriented.
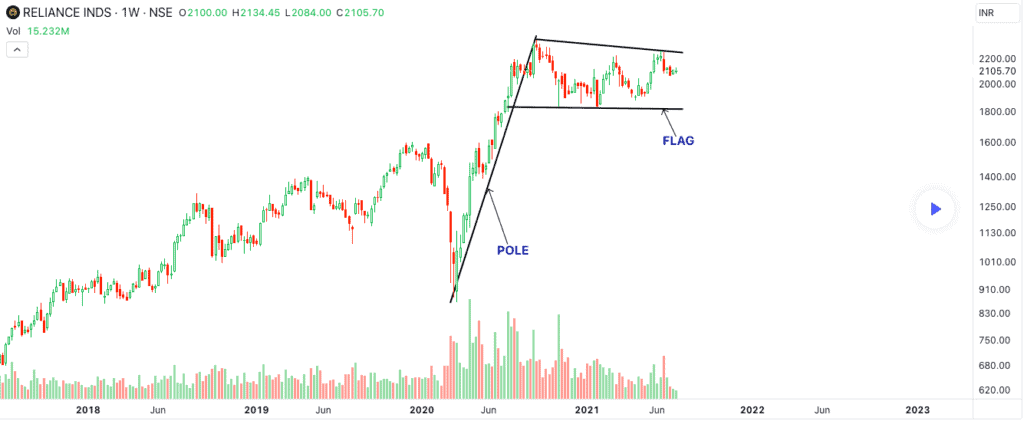
- Bullish Flag Patterns: This pattern forms during an upward trend. It begins with a strong upward price movement that creates the flagpole. Following this, the price enters a channel that slopes downward or remains within a horizontal range, forming the flag. A breakout occurs when the price breaks above the upper boundary of the flag, signaling that the uptrend is likely to continue.
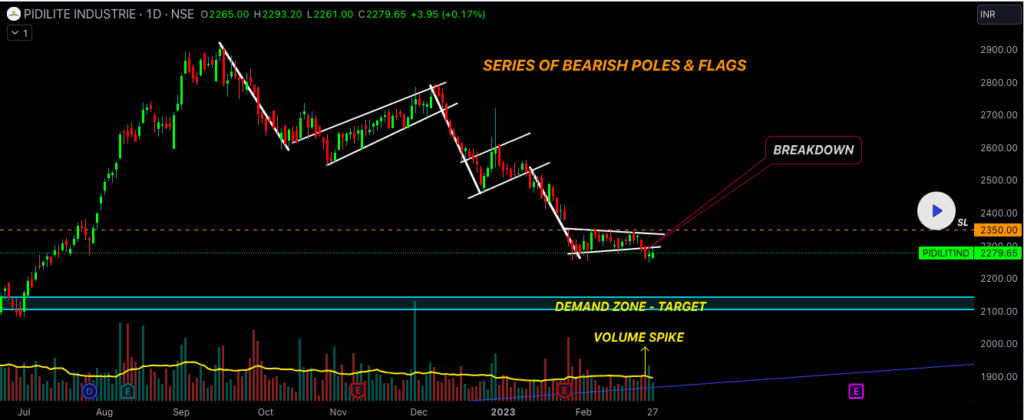
- Bearish Flag patterns: This pattern appears in a downtrend. It starts with a sharp decline in price, establishing the flagpole. Afterward, the price consolidates within a channel that slopes upward or a horizontal range, forming the flag. A breakout happens when the price drops below the lower edge of the flag, indicating that the downtrend is expected to persist.
- Neutral Flag patterns: Unlike the bullish and bearish patterns, the neutral flag patterns do not strongly indicate a continuation of price movement in either direction. Instead, it represents a period of stability within a broader trend, without a clear bias. Like other Flag patterns, it features a flagpole and a flag, but predicting the breakout direction can be challenging.
These Flag patterns assist traders in assessing whether a trend will continue, enabling them to make informed buying decisions.
Bear flag patterns
If you’re scanning stock charts and notice a bit of an upward tick following a big drop, you might be looking at what experts term a ‘bear flag patterns’.
When prices slide downwards, sometimes there’s a brief pause. Here, prices inch upwards for a bit, looking like a raised flag, forming what’s referred to as a flag and pole pattern. The initial drop represents the ‘pole’, while the gentle upward trend is our ‘flag’.
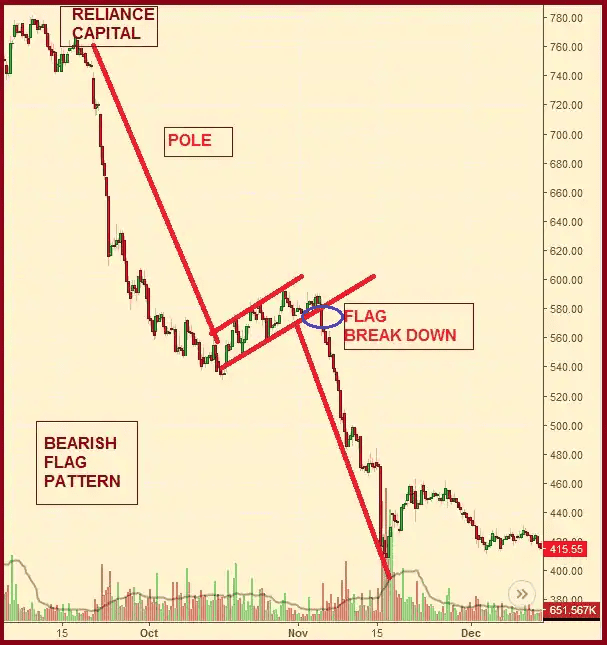
This pattern creates the pole when the asset price undergoes consecutive lower highs and even lower lows. Once the price reaches this new low, there’s a subtle pause. Prices might start to climb a little.
During this short upward trend, buyers might try their luck, attempting to push prices up. Their aim? To challenge the sellers and maybe reverse the trend. However, this results in prices moving within a narrow range or band.
Crucially, this uptrend is deceptive. It indicates that the stock prices, after a brief pause, might continue their southward journey. So, when you spot this pattern, it’s a hint: the prices might take another dive soon.
Bull flag patterns
During a strong upward price movement, there might be short periods where the price dips or moves sideways. This creates a pattern that looks like a flag. Here, unlike the bear flag the initial upward movement is termed the ‘pole’, and the downward movement forms the ‘flag’.
Volume, or the number of shares traded, plays a key role. During the formation of the flag, trading volume usually decreases. This simply means that those traders who played a role in the prior upward trend aren’t in a rush to buy or sell during this time. It’s like the calm before the storm.
Next comes the critical part: the flag breakout pattern. When the price breaks above the flag’s upper trendline, it signals the market’s next move. Due to “FOMO” – Fear of Missing Out most, investors dive in. This urgency increases the trading volumes. Strong volumes during this breakout can signify the likelihood of continued upward movement. Learn intraday breakout trading strategy in this article.
However, if this break occurs with low trading volumes, it can be a warning. The price might drop below the trendline again, cancelling the bullish continuation. So keep an eye on the volume.
Flag patterns trading
Trading with the flag candlestick pattern requires precision and understanding of the market’s pulse.
So when to trade? In a bull flag, traders can buy when the price breaks out above the flag’s resistance with strong volumes. On the other hand, a bear flag signals a potential sell opportunity when the price breaks below the flag’s support, reflecting a continuation of the downward trend. Understanding trends will help you make more money, both when investing and trading in equity.
When a flag patterns emerges amidst a pronounced market trend, it often indicates a prime trading opportunity. Such patterns can manifest in both upward and downward trends, allowing traders to strategise accordingly.
Adopting the flag patterns strategy necessitates flexibility. Some traders prefer a conservative approach, targeting quick returns, while others lean towards a more aggressive stance, in search of potentially bigger gains. Regardless of the approach, the flag patterns remains a pivotal tool for navigating stock market complexities.
Which Trading Strategy is most effective for Flag Patterns?
The most effective trading strategy for Flag patterns is the “breakout strategy.” Flag patterns typically form during a short-term consolidation phase within a strong trending market, either bullish or bearish.
These patterns appear as a small rectangle or parallelogram, representing a pause in price movement before the trend resumes. The breakout strategy focuses on identifying when the price moves outside of this consolidation area, signaling the continuation of the original trend.
So, how to execute this strategy? Well, here are some key steps for the breakout strategy:
- Identify the Flag: First, spot a strong, sharp move either upwards (bullish flag) or downwards (bearish flag), followed by a consolidation phase where the price moves in a narrow range, forming a flag shape.
- Wait for Confirmation: Patience is crucial. Traders should wait for the price to break either above (bullish flag) or below (bearish flag) the flag’s range, confirming the breakout.
- Set Entry Point: Enter the trade once the breakout is confirmed. For a bullish flag, enter once the price moves above the resistance level; for a bearish flag, enter below the support level.
- Use Stop-Loss and Take-Profit: Set a stop-loss just inside the flag’s range to manage risk, and set a take-profit target based on the size of the initial price movement (the “flagpole”).
Now, let’s understand with an example. Suppose a stock rises sharply from ₹500 to ₹600 and then consolidates between ₹590 and ₹600, forming a bullish flag. When the price breaks above ₹600, traders can enter a long position, anticipating that the upward trend will resume.
A stop-loss can be placed at ₹590, and the target could be ₹700, matching the original ₹100 upward move.
This breakout strategy helps traders capitalize on trend continuations while minimizing risk.
Final thoughts
In the world of stocks, the flag patterns is a helpful guide. It tells us there’s a small break in the current trend, but soon, things might pick up from where they left off. So, if prices were going up, they likely would continue that way after the break. And if they were going down, they might keep going down. Learn to identify and interpret share market chart patterns and how technical chart patterns can add to your profits.
Many traders find this pattern reliable. It gives them a hint about where things might go next. But it’s essential to remember that no tool can predict the market perfectly. So, while the flag patterns can give you a clue, always double-check before making a move. Being careful and informed will help you make better decisions in trading.
FAQ’s
The target in a flag and pole pattern is usually estimated by measuring the length of the initial strong price move (the pole) and projecting the same distance from the breakout point of the flag. This helps traders identify a potential price target after the breakout.
A bullish flag forms after a strong upward price movement followed by a short consolidation that slopes slightly downward. It signals a potential continuation of the uptrend.
A bearish flag forms after a sharp price decline followed by a brief upward or sideways consolidation, indicating the downtrend may continue.
The flag pattern can be both bullish and bearish, depending on the direction of the prior trend. A bullish flag appears in an uptrend and signals further upside, while a bearish flag appears in a downtrend and signals potential further downside.