How would you like a tool that gives you a birds-eye view of the stock market with a single glance? Yes, it is indeed beneficial.
The candlestick chart is one such tool that helps you understand how a stock is currently trending in the market. Considering various price points like high, low, open and close, the chart tracks the movement of these stock prices from time to time.
The size and form of each candle varies based on the rise and fall of these prices, thus helping with understanding the current and potential future market trends.
Hence, reading the candlestick chart is a fundamental skill for traders today.
Who is the hanging man?
The hanging man pattern is a candlestick, indicating a potential bearish reversal trend.
It is generally found at the top of the chart after an uptrend, indicating that the prices may go down from there.
Understanding the hanging man candlestick
Fundamental criteria for a candle to qualify as a hanging man candlestick:
- There should always be an uptrend before the occurrence of a hanging man candle. It suggests that the market, which was bullish earlier, may now turn bearish.
- Since it appears after an uptrend, the hanging man candle pattern is found at the top of the candlestick chart.
- The upper wick of the candle should either be minimal or invisible.
- The lower wick of the candle should at least be two times the length of the body.
When the open, close, and high price points are at short distances from one another, but the low price point is far – a hanging man candlestick pattern appears.
You may also like: Inverted hammer vs shooting star: Which candlestick pattern rules the charts?
When a hanging man candle appears, the market is said to be indecisive.
Describing the market scenario:
- The market is in an uptrend, i.e., bullish, before the formation of a hanging man.
- Bears try to take control and pull the market as low as possible. Hence, the lower wick of the candle is far from the other prices.
- Bulls try to regain power and push the market upward to the highest possible extent.
- The market finally closes very close to the open and high price points.
The candle’s opening price following the hanging man must open below the closing price of the earlier candle to confirm the reversal pattern.
If the following candle does not comply, the hanging man candle is considered a false alarm.
Red and green hanging man candle
A hanging man candle can either be red or green in colour.
A green-hanging man candle gets formed when the stock closes at a price greater than the opening price. Here, the highest price point is equal or near-equal to the closing price.
A red-hanging man gets formed when the stock closes at a price lower than the opening price. The highest price point is equal or near-equal to the opening price.
In both cases, the lower wick is at least two times more than the body’s length.
How to trade the hanging man pattern?
If the next candle goes against the assumption of declining prices, no action must be taken.
But, if the next candle confirms the reversal, the traders can enter the short position at the closing price of the confirming candle (The candle after hanging man).
The highest price point of the hanging man candle determines the stop loss.
Also Read: Insights into market trends and reversals using Inverted Hammer
How is the hanging man candle different from the doji candle?
While beginners may mix up the two candlesticks, understanding the difference and examining thoroughly helps resolve confusion.
The hanging man candle may seem like a dragonfly doji at first look. But, the doji has a very thin body since the opening and closing prices are almost equal.
The hanging man candle has a relatively wide body, as the opening and closing prices are near but unequal.
Also Read: Understand dragonfly Doji and its indication of stock market trends.
The difference between hammer and hanging man candlestick patterns
Although both the hammer and hanging man look alike, the idea behind the formation of these two candles is different.
Both the candles can either be in red or in green.
The primary difference between these two candles is their position in the candlestick chart.
While the hanging man candle appears at the top of the chart, the hammer candle appears at the bottom.
In an uptrend, where a reversal is possible, the hanging man is formed to act as a bearish reversal indicator.
In a downtrend, where a reversal is suspected, the hammer candlestick gets formed, indicating a bullish reversal.
Case study
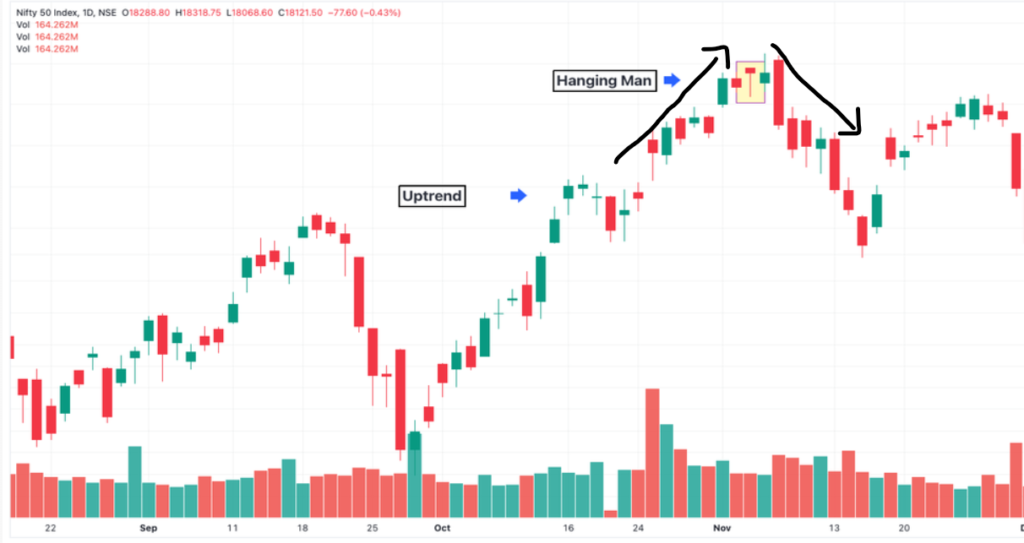
Below is sample of hanging man candle formed on the Nifty 50 Index chart

Bottomline
Like all other candlesticks, the hanging man only serves as a warning and not an assured indication of trend reversal in the market.
Trading strategies and positions based on the confirming candle may not always be accurate.
New traders may likely mistake other candlestick patterns such as hanging man candles, leading to a wrong interpretation of the market trend.
Hence, using other technical indicators with candlesticks for more reliable and accurate results is always advisable.

