For many, the stock market is a mysterious sea. However, some investors dive deep into it. They are traders! Traders seek to tap the price gaps in the market and gain from them. However, trading is a highly risky venture compared to regular investing. A trader needs to consistently follow the market, have appropriate future estimations, tap the correct price, and take the risk of market fluctuations.
Prices and their fluctuations are closely related to mathematical concepts like averages, medians, series, etc. Maths has always been a unique discipline that can be used in several fields. One such field is the stock market.
A niche concept of maths is the fibonacci series. Very few people know that it can be used in the stock market. This series can facilitate the functions of determining target prices and stop-loss. Let’s explore fibonacci retracement and its application in detail.
Fibonacci series and golden ratio
Named after an Italian mathematician, Fibonacci, the series has a unique set of numbers. As per some sources, the series was first discovered in India in 6000-8000 BC by Acharya Virhanka. In this series, a number is the summation of the previous two numbers.
| Term | 1 | 2 | 3 | 4 | 5 | 6 | 7 | 8 | 9 | 10 |
| Sum | 1 | 0+1 | 1+1 | 1+2 | 2+3 | 3+5 | 5+8 | 8+13 | 13+21 | 21+34 |
| No. | 1 | 2 | 3 | 5 | 8 | 13 | 21 | 34 | 55 |
Similarly, a term is determined by adding the previous two terms. However, the magic lies in the ratio. Since the fifth term, if we divide any number by its preceding number, the ratio would be nearly 1.6.
For example: 55/34 = 1.618, 34/21 = 1.619, 21/12 = 1.615 so on.
This ratio is known as the ‘Golden Ratio’. Experts suggest that many natural formations have this ratio in their structure. Thus, it is also known as the ratio of beauty.
Must read: Swing trading vs day trading – What’s the more profitable strategy?
What is fibonacci retracement?
Maths is usually applied in various ways in the stock market. The beauty of the golden ratio and fibonacci series is evident in the fibonacci retracement. It helps determine support and resistance levels for stock market price patterns. It provides stock return levels, which are used for targets and stop-loss.
In this, ratios of fibonacci series (constant over any range of values) are used to mark the levels. Usually, the values return to the following fibonacci ratios:
| Levels | Ratio statement | Ratio % | Example |
| 1. | The number: Next immediate number | 61.8 | 8/13= 61.5%21/34= 61.8% |
| 2 | The number: Second higher number | 38.2 | 8/21= 38.1%21/55= 38.2% |
| 3. | The number: Third higher number | 23.6 | 8/34= 23.5% 13/55= 23.6% |
The stock traders use these % form of ratios 61.8%, 38.2% and 23.6% to mark the levels of stock price movement. Retracement refers to the act of returning to something back. Retracement levels are expected points for traders, which can be touched again. Investors may be confused regarding how to use fibonacci in trading.
How to use fibonacci retracement?
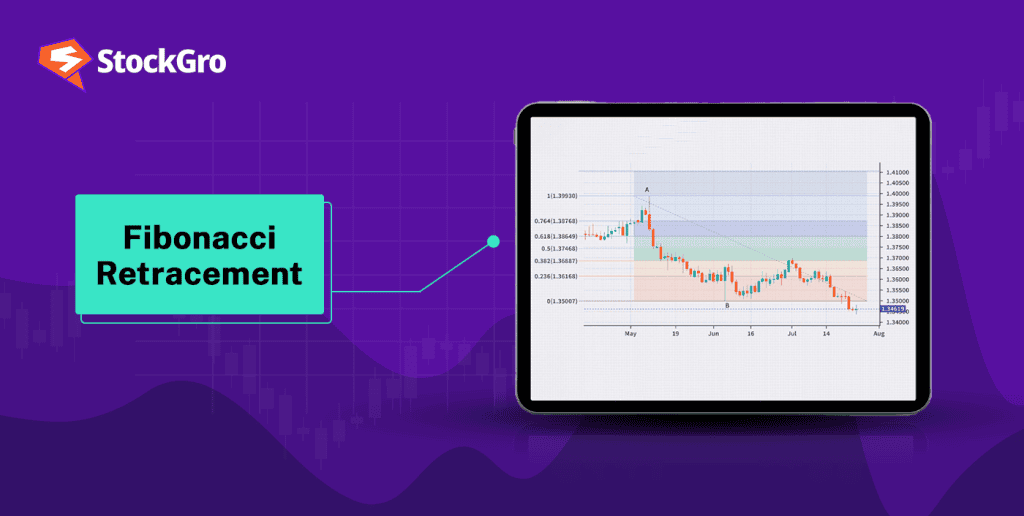
In the technique of ‘fibonacci retracement forecast’, a trader first determines two points of price range movement. Then, the fibonacci levels are marked between this range. Horizontal lines mark these levels. The stock finds its base and resistance at these levels.
Let’s understand with an example:
Hypothetically, currently, a stock is trading at ₹450/-. A trader has observed that in the past, the stock has found its low at ₹423 and has then rallied up to ₹483. So, the fibonacci move or range is ₹60 (₹483-₹423). Here, the stock has rallied up so, the range of ₹60 can be known as fibonacci up move.
- Now, the first level of 23.6% is at ₹468.84
As we calculate it by 23.6% of 60 = 14.16. Further, subtracting it from the highest mark, we get = 483-14.16 = 468.84. Similarly, other levels can be calculated.
- The second level of 38.2% is at ₹460.08.
- The third level of 61.8% is at ₹445.92
Interpretation
After reaching the level of ₹483, the stock may show some correction due to market forces. The stock can bounce to the first level of corrections at ₹468.84. If it keeps moving downwards, the next level to watch can be ₹460.08. Similarly, if the stock breaches this level, it can bounce to ₹445.92. If the stock does not breach the level, the stock can retrace that level. If the stock moves up from that level, it may reach the next level.
Currently, the stock is at ₹450; meaning it has breached the second fibonacci level. So, it may reach the third level of ₹445.92.
Also, read this: 7 Options trading strategies for beginners.
Fibonacci extensions
These are profit booking levels that a trader uses to forecast the gains if the stock is in upward momentum. The levels for such movement are 61.8%, 100%, 161.8%, 200%. These provide a potential target price for a stock.
The fibonacci trading strategy is usually used by traders. Therefore, the trading software has an in-built facility to plot these levels.
Summary
The technique of fibonacci retracement levels is one of a classic amalgamation of logic and maths. Its application in stock markets can be beneficial for ascertaining the potential targets, supports or resistance levels for a stock. However, investors can combine this tool with other factors, while making investment decisions.
Check this out! Your comprehensive guide to successful share market investing
FAQs
Q1. How to use fibonacci retracement?
Fibonacci levels are 61.8%, 38.2% and 23.6%. They can be calculated by measuring the range of price levels based on past stock movement.
For example, the prices are ₹20 and ₹70. The range is ₹50. So, ₹12.8 (50*23.6%) would be deducted from the high of ₹70. The first level is at ₹57.2. Similarly, the other two levels can be calculated. These levels show resistance and support for the stock.
Q2. How to place the fibonacci chart?
Previously, traders had to calculate the fibonacci levels for the stock and place horizontal lines at those levels to ascertain the bounce-back level. However, with the help of technology, the fibonacci chart can be placed directly with a similar option available on the trading software. Moreover, these can also be easily changed as per the moving prices or estimations of a trader.
Q3. What is 100% fibonacci retracement?
A stock is said to have experienced 100% fibonacci retracement if it breaches all three fibonacci levels and bounces back to its lower levels. The 0% level is the start of retracement or can be termed as the highest mark of the range. Moreover, there are three retracement levels of 23.6%, 38.2% and 61.8%.
Q4. What is the golden ratio?
The fibonacci sequence is the series of terms in which a number is calculated by the sum of the previous two digits of the series. The series spans up to infinity. The series can be 1,1,2,3,5,8,13,21,34,55,89, and so on. The ratio of a number to its previous number is always 1.6. It is known as the golden ratio. The ratio is present in all natural things. Thus, it is also known as the ratio of beauty.