Ever felt confused by looking at stock market charts? You’re not alone! Today, we’re talking about a pattern traders often use called the “inverted head and shoulders.” It sounds fancy, but it’s really just a helpful way to predict what might happen in the market. And the best part? It’s simpler than you think! Here is a beginners guide to candlestick patterns.
What is an inverted head and shoulders pattern?
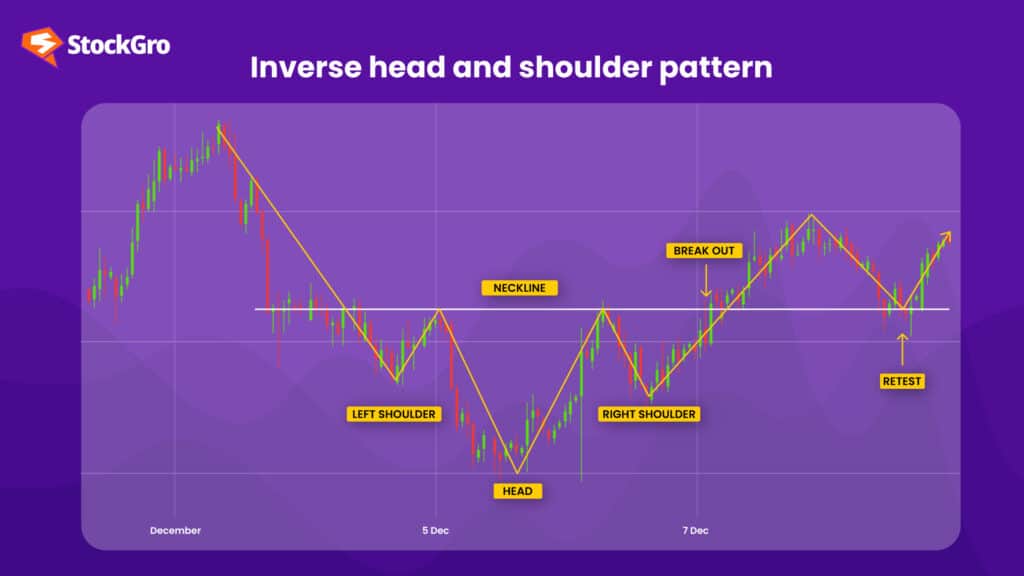
Imagine a line-up of three people. The person in the middle is shorter than the two people standing on either side of him. The inverted head and shoulders pattern in trading charts has a similar appearance.
This pattern occurs when the price of a stock or asset makes three distinct moves: a dip, a deeper dip, and then another dip that mirrors the first. This sets up the pattern that looks somewhat like an upside-down human head and shoulders.
But why is it so important? Well, it’s like a silent drum roll in the market, often signalling that the asset is gearing up for a significant upward movement.
You may also like: Insights into market trends and reversals using Inverted Hammer
Components of the pattern
Understanding the pattern means breaking it down into its parts. Here are the essential elements you should know:
- The left shoulder
This is the first dip in the price. Traders often see this as a typical downturn, but little do they know that it’s the start of something more significant.
- The head
The most crucial part of the pattern is the head, which is the deeper dip in the price. This is where many investors might panic or sell, thinking the asset is on a downfall. However, if you recognize the potential for an inverted head and shoulders pattern, this could be a great buying opportunity.
- The right shoulder
The third dip is usually similar in depth to the left shoulder. When this occurs, savvy traders are on high alert for a breakout, i.e., a significant price increase.
- The neckline
Connecting the tops of the two shoulders is what traders call the “neckline.” Once the price breaks above this line, it’s usually a good indicator that the asset will continue to rise.
How to spot the pattern
How do you spot this helpful pattern among all those zigzags on the chart? Learn how to leverage the daily chart for better trades. Here are some easy tips:
- Look for a downtrend: The pattern typically forms after an extended period of declining prices.
- Identify the shoulders and head: Watch for the three distinct dips we discussed earlier.
- Locate the neckline: Draw a straight line connecting the peaks of the shoulders. This is your neckline.
| Part | What to Look for |
| Left shoulder | First dip in the price |
| Head | Deeper, central dip |
| Right shoulder | Second, usually symmetrical, dip |
| Neckline | Line connecting tops of shoulders |
How to use the pattern for trading
- Identify the Pattern
To identify the inverse head and shoulders pattern, look for three distinct troughs on a price chart.
The first trough is the left shoulder, the second, deeper trough is the head, and the third, similar to the first, is the right shoulder. This pattern usually appears after a downtrend. The head is the lowest point, while the shoulders are roughly equal in height.
Spotting this formation suggests a potential reversal from a bearish trend to a bullish trend in the market.
- Calculate the target price
Once the pattern is identified, calculating the inverse head and shoulders pattern target can give you an idea of how high the price might go. Measure the distance from the neckline to the bottom of the head and add that number to the neckline. This will give you a good estimate of the target price.
While this pattern is a strong indicator, it’s not foolproof. Setting a stop-loss order just below the right shoulder can help minimize losses in case things don’t go as planned.
- Be patient
To effectively use the inverse head and shoulders pattern for trading, patience is key. It’s crucial to wait for the price to break above the neckline to confirm the pattern.
Premature trading can result in losses as false signals may occur. Patience allows you to avoid entering trades too early and ensures that the reversal is genuine.
Once the breakout happens, confirm it with increased volume, which strengthens the signal.
- Set stop-loss orders
Setting a stop-loss is crucial to manage your risk when trading the inverse head and shoulders pattern.
A stop-loss is an order placed to sell a security when it reaches a specific price, preventing further losses. While this pattern is a strong indicator, it’s not foolproof. In this pattern, you should place your stop-loss just below the right shoulder or the lowest point of the pattern.
This way, if the price moves against you, your loss is limited. It acts as a safety net, ensuring you don’t lose too much on a failed trade.
- Target Price
The target price is calculated by measuring the distance between the lowest point of the head (the middle trough) and the neckline (the resistance line connecting the two shoulders).
Once the price breaks above the neckline, this distance is added to the breakout point to set your target price. For example, if the distance is 20 points and the breakout happens at 100, your target would be 120.
This helps estimate potential profit from the pattern’s breakout.
Real-world examples and applications
| Asset Type | Trigger Events for Pattern Formation |
| Stocks | Earnings reports, product launches |
| Commodities | Economic data, currency fluctuations |
| Forex | Geopolitical events, economic indicators |
| Bonds | Interest rate changes, economic policy |
Benefits and limitations
Like any tool, the inverse head and shoulders pattern has its pros and cons.
Benefits
- Easy to spot: Once you know what to look for, this pattern is relatively straightforward to identify.
- Reliable: It’s one of the more dependable indicators of a bullish trend.
- Versatile: This pattern can be found in various time frames and markets.
Also Read: What do these symmetrical triangle patterns suggest?
Limitations
- False signals: While generally reliable, the pattern can occasionally give a false breakout signal.
- Requires confirmation: Traders often wait for other indicators like trading volume to confirm the pattern.
- Not a guarantee: The financial markets are influenced by a multitude of factors, and no single pattern can predict them with 100% accuracy.
Practical tips for beginners
If you’re new to this, here are some quick tips to get you started:
- Practice spotting: Before you risk any real money, practice spotting this pattern on historical charts or paper trading platforms.
- Identify the Pattern Correctly: Look for three distinct troughs in a downtrend: the middle (head) is the lowest, and the two on the sides (shoulders) are higher and relatively equal.
- Wait for the Neckline Breakout: The pattern is confirmed only when the price breaks above the neckline (a line connecting the highs of the two shoulders). Avoid entering trades before this breakout.
- Use Higher Time Frames: Higher time frames (like daily or weekly charts) provide more reliable patterns compared to shorter time frames, which can be noisy.
- Check Volume Confirmation: Volume should typically increase during the right shoulder formation and significantly rise during the breakout above the neckline, indicating strong buying pressure.
- Set Your Entry Point Wisely: Enter a trade once the price closes above the neckline with a strong volume. Avoid rushing in at the first sign of a breakout.
- Place Stop Loss Below the Right Shoulder: To manage risk, set your stop loss just below the right shoulder’s low. This helps minimize losses if the breakout fails.
- Measure the Target Price: To estimate the potential price target, measure the height from the head to the neckline and add this distance to the breakout point.
- Be Patient with Pullbacks: Sometimes, the price retests the neckline after breaking out. Use this pullback as a secondary entry opportunity if you missed the initial breakout.
- Pair with other indicators: For better accuracy, use other technical indicators like Relative Strength Index (RSI) or Moving Average Convergence Divergence (MACD) alongside.
- Avoid Overtrading: Not every pattern will result in a profitable trade. Be selective and avoid trading every formation you see.
Keep learning: The inverse head and shoulders pattern is just one tool in the trader’s toolbox. The more patterns and strategies you learn, the more versatile you become.
| Tips for Beginners | Description |
| Practice spotting | Use historical charts to identify patterns |
| Pair with other tools | Combine with RSI, MACD, etc., for improved accuracy |
| Keep learning | The more tools you know, the more versatile you become in trading |
Conclusion
The inverted head and shoulders pattern isn’t just a difficult term. It is rather a tried-and-tested method which the traders have been using for years. The pattern suggests that the value of an asset is likely to go up, so it’s a good idea to pay attention.
If you know how to identify this pattern on a chart and calculate its particular target, you’ll be better equipped for your trading journey.
So, the next time you’re finding it difficult to glance through the complex graphs and data, keep an eye out for the distinct shape of an inverted head and shoulders pattern. Learn different stock market chart patterns. It could be your key to making a profitable trade!