Introduction
In the trading world, it is crucial to understand the movement of volume and price. One tool that traders often use to analyse these movements is the on balance volume (OBV) indicator.
Developed by Joseph Granville in the 1960s, the OBV indicator is a valuable tool that analyses price movements and volume data, helping traders make more informed decisions.
Let’s understand what this indicator is, how it is calculated, what’s the interpretation and more!
What is an OBV indicator?
OBV full form stands for On Balance Volume. The on balance volume indicator is a momentum-based tool that leverages the volume level to provide insights into the strength of a trend and potential trend reversals.
It measures the buying and selling pressure, accumulating volume when prices rise and deducting it when they fall.
Primarily used in trading stocks, indices, commodities, and Forex, the OBV is a pure momentum oscillator, much like the Relative Strength Index (RSI).
You may also like: Aroon indicator: Overview
The on-balance volume indicator is based on a simple premise: when an asset closes higher than its previous close, all the volume for that day is considered as buying volume. Conversely, when an asset closes lower than the previous close – the volume is classified as selling volume.
The OBV line is a cumulative total of these buying and selling volumes. The line starts at zero and increases when the buying volume exceeds the selling volume, and it decreases when the selling volume surpasses the buying volume.
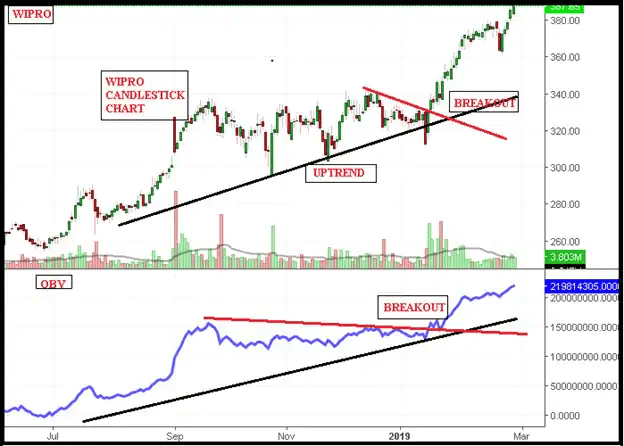
Source: Moneycontrol
How is it calculated?
The computation of OBV is straightforward. If the closing price for a certain period is higher than the one before it, then the volume is positive. In contrast, if the asset’s closing price drops lower than the previous one, the volume is negative.
When the closing price of the day surpasses that of the previous day, the volume of the current day is added to the OBV of the previous day to get the current OBV.
Current OBV = Previous OBV + today’s volume
If the closing price of the day is less than that of yesterday, then today’s volume is subtracted from yesterday’s OBV to calculate today’s OBV.
Current OBV = Previous OBV - today’s volume
If today’s closing price matches yesterday’s closing price, then there’s no change, and today’s OBV remains the same as yesterday’s OBV.
Current OBV = Previous OBV
Interpretation of OBV
Traders typically focus on the rate of change in OBV, rather than its absolute value, to generate trading ideas. A substantial shift in OBV in a particular direction could indicate a significant price movement in the same direction.
Here are some ways to use OBV to analyse price trends:
- When both the price and the on balance volume (OBV) are on an upward trajectory, making higher peaks and higher troughs, it is a strong indication that the upward trend will be sustained.
- In contrast, if both the price and OBV are descending, creating lower peaks and lower troughs, it is a strong signal that the downward trend is likely to persist.
- If OBV rises during a period of sideways price movement, it could suggest buying pressure, signalling a potential upward breakout.
- If OBV decreases during a period of sideways price movement, it could suggest selling pressure, signalling a potential downward breakout.
- If the price is making higher highs, but OBV is not, it could mean that the uptrend is losing momentum or even reversing. This is known as negative divergence.
- If the asset’s price is making lower lows, but the on balance volume is not, it could mean that the downtrend is losing momentum or even reversing. This is known as positive divergence.
Also read: Here’s how you can use the MACD indicator
How to read OBV divergences?
If you are a trader looking for potential trend reversals, the on balance volume (OBV) indicator can help you out. Here’s how it works:
- Imagine the price dipping lower and lower, but the OBV is climbing. This phenomenon is known as a bullish divergence. Despite the downward trend in price, the OBV indicates an increasing number of buyers. This could potentially signal an impending shift towards a bullish market.
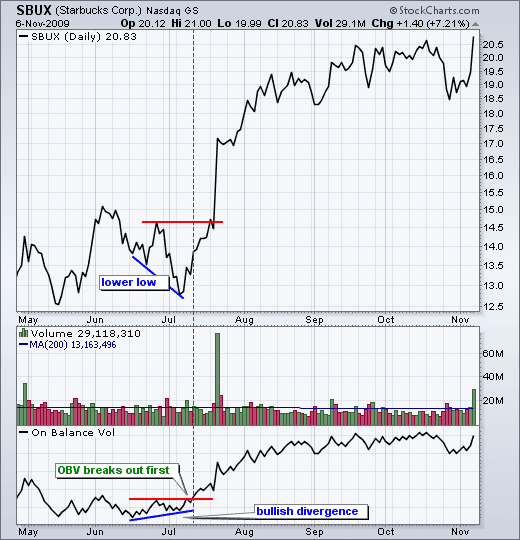
Source: StockCharts
- On the other hand, if the price is soaring high, but the OBV is not keeping up, there is a bearish divergence. The price is upward, but selling pressure is building up. It can signify that a bearish reversal might be just around the corner.
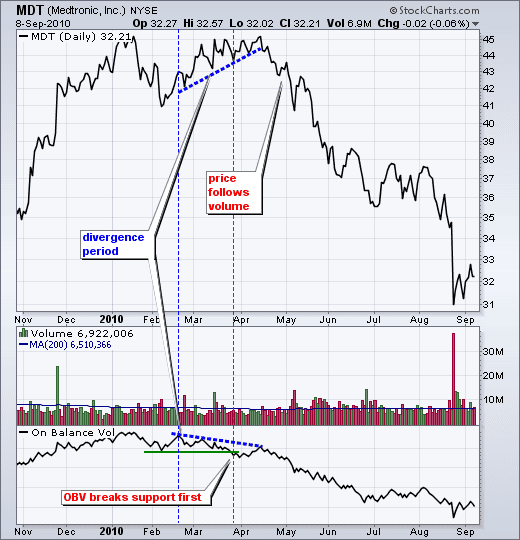
Source: StockCharts
Spotting these divergences can give you a heads-up about possible market shifts, helping you make your move at just the right time.
How to use OBV for trend confirmation?
The on balance volume indicator can also be used for trend confirmation. When both the price of the security and the on balance volume (OBV) are rising, creating higher highs and higher lows, it’s a strong indication that the upward trend will likely persist.
Conversely, if both the price of the security and OBV are on a downward path, forming lower highs and lower lows, it’s a strong signal that the downward trend is likely to continue.
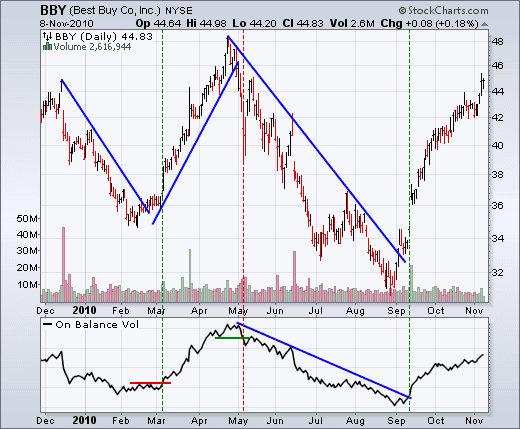
Source: StockCharts
Limitations of OBV indicator
Just like any other tool, the on balance volume (OBV) indicator has its own set of limitations that you should be mindful of before incorporating it into your trading strategy. It is always a good idea to pair the OBV with other technical and fundamental analysis tools for a more comprehensive trading approach.
You may also like: What is ADX indicator? Make informed trades by tracking market trends.
One thing to note is that the OBV might not be the most suitable tool for day traders. Since it is calculated when the market closes, it may not give the real-time buying and selling signals that day traders need.
Also, note that the OBV is a leading indicator, and it can sometimes give false signals. While it can provide early signals, interpreting it is not always straightforward.
Bottomline
In conclusion, the on balance volume (OBV) indicator is a powerful tool in a trader’s arsenal. Analysing volume flow helps traders predict potential price movements and confirm trends.
However, it is essential to remember that, like all trading indicators, the OBV should not be used as a standalone tool. It is most effective when used with other indicators and analysis methods.