The National Stock Exchange has become the world’s fourth largest based on market capitalisation.
This growth trajectory would not have been sustainable without the participation of individual investors in the capital markets. However, for any new investor, making prudent trading decisions can be daunting.
Thus, understanding price action trading becomes non-negotiable.
Price action trading refers to the quantitative method of analysing current prices with respect to past price changes to make analysed trading decisions. A prominent tool for price action trading is a pin bar candlestick.
Let us explore the pin bar pattern in detail.
Also read: Fundamentals vs. FOMO: Analyzing the Impact on Market Movements.
What is a pin bar candlestick pattern?
A pin bar is a candlestick-like pattern which indicates price movement. It helps a trader to understand trend reversals. Trend reversal refers to a pattern in which the direction of stock price movement changes. If a stock price is moving in an upward direction and it suddenly starts moving in a downward direction, it is called trend reversal.
Components of a pin bar pattern
It is very important to understand the representation of a pin bar candlestick to understand its meaning. A pin bar pattern has three components.
Body
The body of a pin bar indicates that the price closed and opened at about the same level. When the opening price is greater than the closing price, the top breadth indicates the opening value and the bottom breadth indicates the closing value. Similarly, when the closing price is greater than the opening price, their positions reverse. Therefore, the longer the body of the candlestick, the higher the difference in their prices.
Upper wick
This is known as a nose. The upper wick of a candle symbolises the highest price point attained throughout the candle’s trading session.
Lower wick
The lower wick is also referred to as the tail or shadow. A candle’s lower wick symbolises the lowest price point attained throughout its trading session.
The various changes in the appearance of these three components of a candlestick indicate different trends. Analysis of these trends gives valuable market insight that makes trading analysed and informed.
The two types of pin bar pattern
Before we get into how trading happens with the help of pin bars, it is important to understand the two main types of pin bar candlesticks.
The bullish pin bar pattern
A bullish pin bar pattern is likely to appear near the close of a downtrend or downward movement. A downward trend refers to a decrease or an overall fall in the movement of a stock. The appearance of this candlestick indicates a possible turnaround of the downtrend into a probable bullish trend in the stock market which means an overall upward movement of a stock’s price.
The bearish pin bar pattern
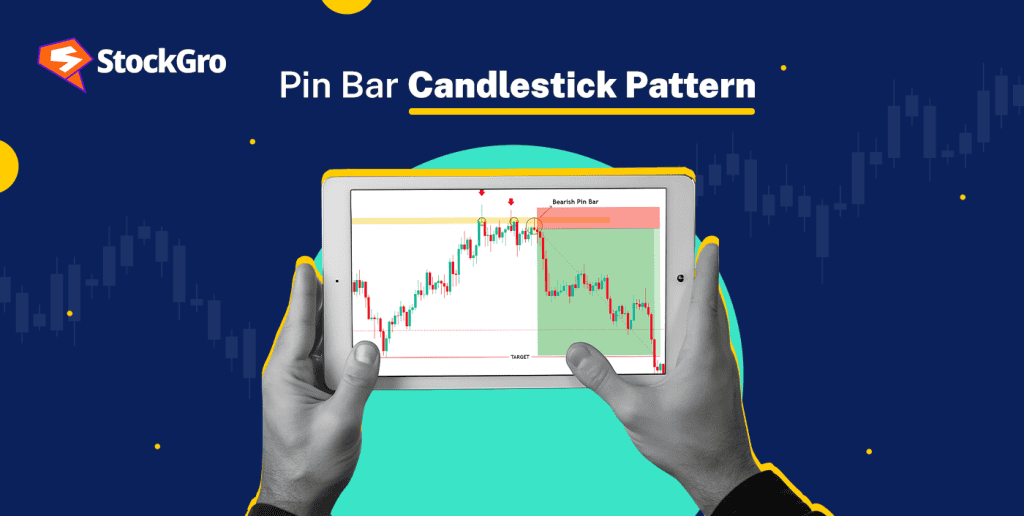
A bearish pin bar might appear near the close of an uptrend or upward movement on the candlestick chart. It marks the transition from an upward trend where the prices are moving upward to a bearish trend in which there is an overall downward movement of the prices.
When an investor or a trader can successfully distinguish and read a bullish and bearish pin bar trend, it becomes easy to plan the buy, sell and hold actions.
Also read: Understanding Maximum Drawdown (MDD) in Investments: A Vital Risk Management Tool.
Pin bar trading
Now that the meaning, appearance and types of candlesticks are clear. Let us venture into the key question: How do candlestick patterns help trading?
Indications from components
The body of a pin bar indicates a bullish and bearish trend. In the case of both bearish and bullish trends, the body of a candlestick remains short.
A bullish pin bar has an upper wick that is shorter than or equivalent to the candle’s body. In contrast, a bearish pin bar’s top wick is larger than the body and lower wick put together.
For a bullish pin bar, the candle’s bottom wick is larger than its body and upper wick combined. In contrast, a bearish pin bar has a lower wick that is shorter or equivalent to the candle’s body.
Conclusion
A pin bar candlestick is widely used to identify changes in trends and trading patterns of traders. However, one should use prudence when making a judgment based entirely on the pin bar candlestick, as they have limitations.
They can frequently provide erroneous signals, particularly in turbulent or chaotic market situations. Traders should employ extra confirmation techniques to evaluate pin bar signals. Moreover, pin bars cannot accurately forecast future market circumstances on their own. Therefore, performing due diligence before making any decision is crucial.
Also read: A Guide to Span and Exposure Margins in Trading: Key Concepts Explained.
FAQs
- What are some mistakes when trading with a pin bar?
Investors should not base their investing decisions on a single Pin bar candlestick pattern. It is critical to be aware of false breakouts and to constantly employ effective risk management measures. Along with price action strategies, it is important to do thorough research on the company. Good companies with sound financial structures which are reflected in their statements will always give good returns.
- What does a pin bar candle indicate?
A candlestick indicates a transition from a downtrend to an uptrend. It can also indicate the opposite, i.e., a transition from a bullish to a bearish market. A pin bar can either indicate a shift from an uptrend to a downtrend or a shift from a downtrend to an uptrend. The same tool can indicate the two opposite scenarios through various structural changes in its three components.
- Are pin bar and hammer the same?
A hammer is a bullish pin bar candle with a lengthy lower wick that appears after a downturn to indicate an impending upward reversal. A pin bar can be bullish or bearish, while a hammer only relates to the bullish variety. It is a short green candle with a long tail, signalling lower market price rejection.
- Can the bullish pin bar be red?
The colour of a pin bar usually indicates a trend. Although both red and green can be used to indicate a bullish pin bar, green is usually used to indicate a bullish pin bar. It signifies a revival of the market and an upcoming positive trajectory. This variety of candlestick, also known as a hammer, is often used to indicate a shift from a downtrend to an uptrend.
- What colour is bearish?
Red is used to indicate a bearish pin bar. It signifies an upcoming downward turn of the market and a bearish trajectory. A bearish candlestick indicates a shift from increasing prices to a decreasing price. More than the colour, it is the structure of the candlestick itself that indicates whether it is bearish or bullish.

