Analysing stock trends is one of the most essential factors for profitable trading. But how do you analyse trends? Well, there are multiple tools in the market for varied purposes. Some well-known tools for technical analysis are candlesticks, bar charts, triangle patterns, etc. Similar to those is another tool that uses bricks to focus on significant price trends in the market – The Renko charts.
In today’s article, we will learn what Renko charts are and how to decode their patterns to formulate profitable trading strategies.
What is a renko chart?
Renko is derived from the Japanese term “Renga,” meaning brick. The brick-like chart is a price-only market that doesn’t consider time like other charts. These charts function by consolidating minor price fluctuations into larger blocks. Renko charts are favourable to many traders because they eliminate slight price fluctuations.
Since renko charts do not depend on time, the renko trading strategy may be more suitable for swing or position traders than intraday traders. Here, the brick’s actual size is the only criterion to be established.
You may also like: Understanding the descending triangle pattern in technical analysis
How does a renko chart work, and what is indicated by it?
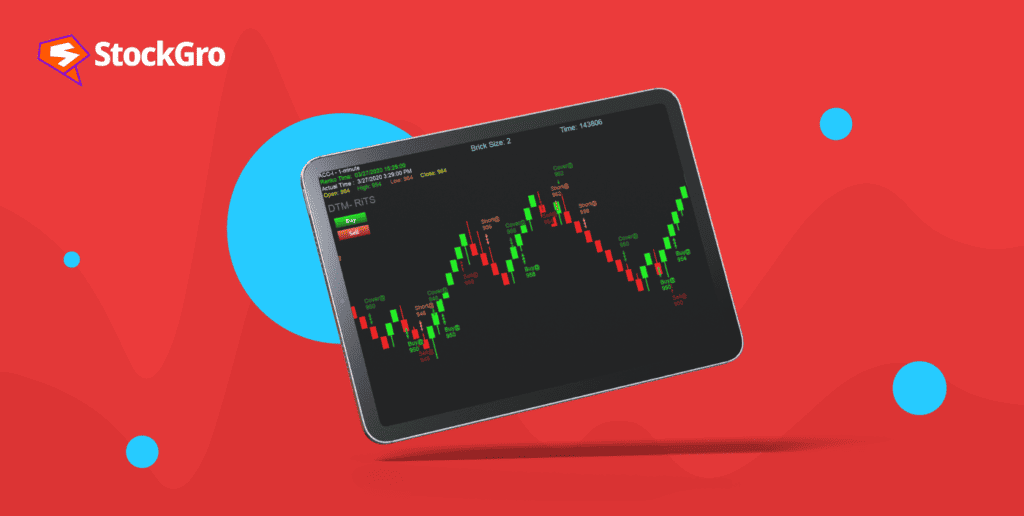
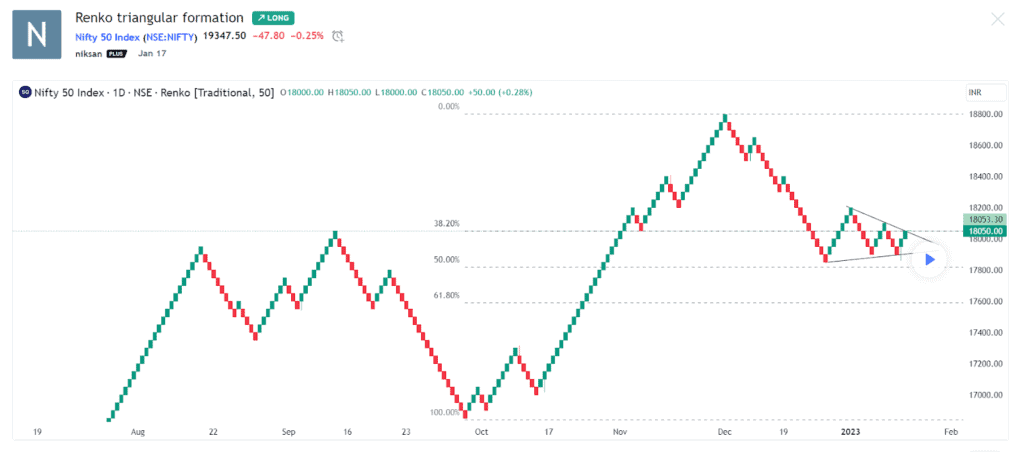
The bricks are seldom placed exactly next to one another. The user sets the size of each brick on the renko chart and the time at which a new brick forms. Every time the price changes by a predetermined amount, a new brick is made, and each block is placed 45 degrees – either up or down – to the right of the previous brick.
A down brick is often coloured red or black, while an up brick is usually coloured white or green. The boxes, or “bricks,” that make up a renko chart only display major price movements.

These boxes are the most crucial aspects of these charts. In renko charts, a given brick or box forms whenever the price moves to a predetermined price. For example, if you set the box size to ₹20 in the equity market, a box will be created only when the price moves by ₹20.
The purpose of renko charts is to exclude small price fluctuations to make it simpler for traders to focus on significant trends. However, there is also a downside to this. The negative is that some price information is lost because of the fundamental brick architecture of renko charts, even though this simplifies the process of identifying trends.
The trader’s trading objectives, time frame, and risk appetite all play a role in determining the ideal box size for a renko chart. Longer-term traders should employ larger box sizes since they better capture minor price changes that compound over time. However, larger box sizes also come with more risk.
Renko chart strategies in trading
Many trading methods, particularly those involving forex, work well with renko charts. Several standard procedures necessary for traditional price charting are well-suited to renko charts as a price analysis method. When it comes to choosing a renko chart strategy, there are excellent trading opportunities, like:
Trend trading
One of the most popular methods is the trend trading approach to determine market momentum. Your brick size is your primary tool in this renko trading approach. A stock’s market’s price will move further before a brick forms, depending on the brick size you choose for your renko chart.
Let’s say your brick size is five points. For the movement to appear on your chart at all, the stock must move by a minimum of five points. If the market’s direction shifts—for instance, from an upward trend to a downturn—the price must decrease by a minimum of 10 points to reflect the new market direction.
Although renko charts are useful for spotting trends, they have a drawback when used alone: other than observing how long a trend continues, there is no reliable way to determine how reliable it is, which some traders find to be too retrospective.
Breakout
Additionally, a breakout strategy might make use of renko charts. Since block sizes are determined by average true volatility (ATR), which is also frequently employed in breakout trading methods, breakout tactics utilising renko charts are very intriguing.
Also read: The double top breakdown: Profit from chart patterns
Because levels of support and resistance are also used in breakout trading, it bears similarities to range trading. But the idea here is to take advantage of the inherent inclination of your renko chart to display market momentum and use it to predict when the price will ‘break out’ of those levels. This technique aims to enter the market early in an emerging pattern and set your stop-loss for when the market turns around.
Range trading
When using a range trading technique, renko charts can be helpful. Traders may use renko charts to identify breakout possibilities if there is a range present. Thus, range trading methods can make use of renko charts. With a range trading technique, you can use charts because the market moves that show up on your chart depend on your brick size. This is because range trading involves the market moving between two price levels known as “support and resistance.”
Renko charts are simple to use, so you can use their simplicity to identify upward or downward market movements by choosing your brick size appropriately and placing well-considered stop losses and limit orders.
Renko chart trading: Pros and cons
Day traders find that renko charts are particularly helpful in identifying trends and more. Their simplicity may help traders spot those price movements and trading signals more easily. However, these charts also come with some limitations. Let’s break down the strengths and weaknesses of renko charts.
Renko charts are not as detailed as candlestick charts since they do not rely on time. For certain traders, this might be advantageous, but not for others. Because short-term noise is removed from the renko charts, they offer a more comprehensive picture of the market. This is particularly helpful for traders to locate regions of support and resistance in the market.
Renko charts let traders profit from long-term trends and spot markets where a trend has turned around. When to offset holdings in trending markets can be determined with the use of this.
Also read: Triangle chart patterns: A smarter way to technical analysis
Conclusion
Trading involves losing trades all the time, no matter what trading method or chart style you use. Traders do, however, always have the option to manage their risk and the amount of capital they are willing to lose on a trade. In this context, renko charts eliminate noise by concentrating only on the important price fluctuations, helping the traders get a cleaner-looking chart.

