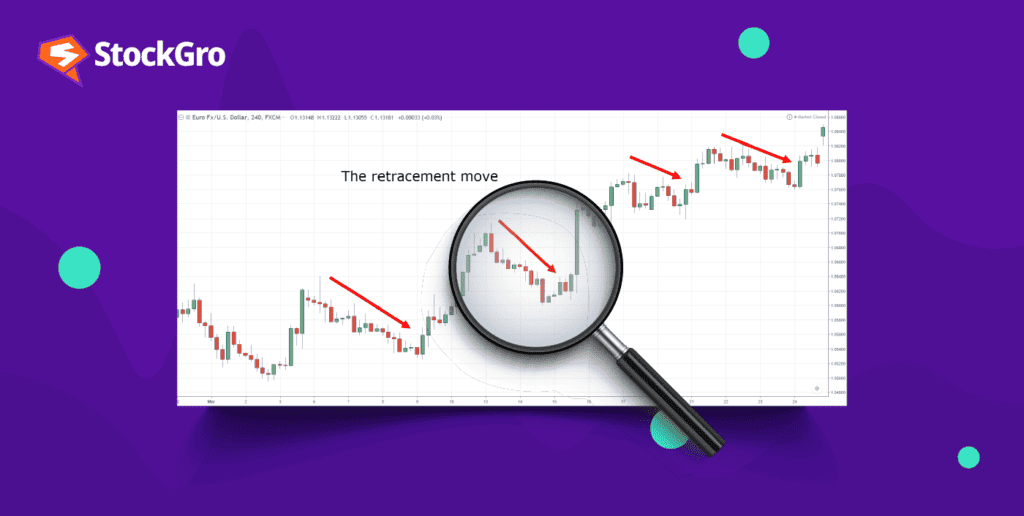
A retracement is a technical analysis term that you’ve definitely heard of if you’ve ever read a trading article. A retracement is a small pullback from its current direction towards the opposite. For instance, in a market that’s rapidly moving up in price, a retracement would mean that the price went down, and vice versa.
Understanding the technicals of a retracement
Retracements are generally temporary movements, meaning that they do not signal a greater trend in the overall market. In simpler words, a large rally with a retracement doesn’t necessarily mean that the rally is over. This is unlike reversal patterns.
When there’s a retracement in the market, you would notice a short movement against the trend for some time, and a continuation of the same trend some time later.
It is worth noting that retracements are quite common. Hence, just like any other technical indicator, they aren’t worth very much by themselves. When combined with other indicators, however, they could yield some interesting results.
You may also like: A comprehensive guide to reversal candlestick patterns
Why are they important?
Even though they’re temporary movements, retracements can be very important for traders.
Very often, traders will get disheartened because although they were technically right on a trade, price volatility triggers their stop losses and they get knocked off the market. By learning to wait for retracements and pullbacks, you will learn not only to enter the market at a better price, but also to place stop losses at points that price in these movements.
The difference between retracement and reversal patterns
| Retracement | Reversal |
| A retracement is like a temporary pause or a small step back in the price movement. | A reversal marks a more significant change in the trend of the stock or asset. |
| Prices might move against the primary direction temporarily before continuing along the same path. | It’s like making a U-turn in the movement; the price stops its current direction and begins moving in the opposite direction. |
| Typically, during a retracement, a rising stock would experience a brief dip before bouncing back up and continuing its upward trend. | It indicates a complete change in the trend. |
Also Read: Here’s how you can use the MACD indicator
Pros and cons of retracement trading
Just like any other trading strategy, trading retracements also come with their own pros and cons:
Advantages of retracement trading
- Higher probability entries – Retracement-based trading provides you with a higher probability of successful entries. This is because the retracement trading strategy follows the concept that price is likely to continue in the direction of the initial move after a retrace.
- Better stop loss placements – Retracement trading allows more flexible stop-loss placement, enabling stops to be positioned further away from areas likely to be hit, increasing your chances of success.
Disadvantages of retracement trading
- Higher opportunity cost – Waiting for retracements that do not occur may result in you missing out on good trade opportunities. This could be a challenge because you’d be more likely to lose discipline.
- Fewer overall trades – Markets might not retrace enough to trigger the conservative entries you’re waiting for, leading to fewer trade opportunities compared to your peers who aren’t waiting for retracements.
Also read: The ABCs of stock market: Consolidation and Breakouts
A few retracement trades
- Using the Relative Strength Index (RSI): If a stock’s price experiences a rapid increase, leading to overbought conditions, traders will typically expect a pullback in the market. The RSI, in this case, can indicate whether the market is overbought or oversold. Suppose after a strong uptrend, the RSI indicates the stock is overbought. This combination might suggest a reversal is imminent, which could potentially be a good entry point for a short trade.
- Using the Moving Average Convergence Divergence (MACD): If a stock shows a downward trend, but traders are unsure if it’s a reversal or just a retracement, the MACD can be used to confirm potential reversals.
- Monitoring volume data – If a stock is in an uptrend but experiences a pullback with increased volume, this could indicate a potential reversal.
Conclusion
In conclusion, retracement patterns can be a valuable tool for your trades, offering you a deeper understanding of market movements and aiding in strategic decision-making. These patterns, which reflect temporary pauses or reversals within an ongoing trend, provide critical insights into potential entry and exit points. They also let you place your stop losses better in volatile market conditions, ensuring that you don’t get knocked out prematurely.