Traditionally, the stock market was a less preferred investment destination due to the market risk associated with it. Investors would fear market fluctuations and buying-selling pressure. However, in modern times, we see a shift in investor’s perspective towards the market.
Did the feared fluctuations reduce? No, but investors have gradually started understanding the rationale behind the functioning of the stock market. The secret behind this is understanding decoding target stock market volatility. It can help investors identify and manage the fluctuations.
Let’s understand the stock market volatility in detail, measure it and explore some stock market volatility tips.
What is stock market volatility?
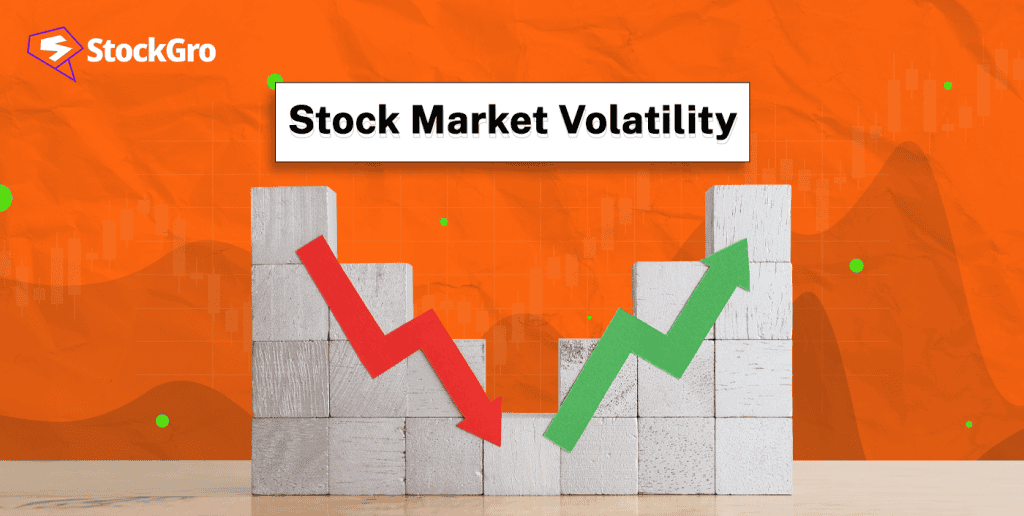
Generally in the layman’s term, volatility is concerned with constant fluctuations in the stock market prices due to the power of buyers and sellers. Stock market volatility can also be referred to as the condition or rate of price changes in the market.
High volatility indicates quick price movement and fluctuations. Moreover, it shows low investor confidence. In such situations, the small investors are usually prone to impulsive decisions. Therefore, understanding the stock market volatility is important for risk management.
Significance
Fear and greed are crucial emotions. Every investor is unique in terms of their perspectives and investment psychology. When these philosophies clash, the buying and selling pressure causes volatility. Moreover, due to this the stock makes high highs and low lows or fluctuates sideways.
Understanding stock market volatility can help investors stay calm during volatile conditions or prepare and hedge for it. It will also retain their value in the long term and help gain potential from compounding.
Also, read about Key risks in investing in the stock market.
Factors causing volatility
- Company-specific news
Investors analyse a stock by understanding the company’s fundamental business details. Sometimes a company’s specific positive or negative news can confuse investors and make differing perspectives. It can create volatility in the market. Quarterly earnings, annual results, new projects, controversies, industry-related conditions, etc., can cause market volatility.
- Economic conditions
Businesses and economics are intertwined aspects. Certain microeconomic and macroeconomic conditions have significant effects on the market. Investors relate it with the company’s key performance indicators and determine the probable impact.
However, this depends on an individual’s perspective, which collectively causes market volatility. Some economic conditions are interest rate changes, monetary policy decisions, market bubbles, financial crises, etc.
- Political news
National and global political scenarios decide the regulatory flow of an investment. These have crucial impacts that can cause market volatility. Budget announcements, inter-country alliances, trade agreements, wars, etc., are some key political factors causing market volatility.
- Natural conditions
Some natural calamities or discoveries can potentially change the course of a business or industry. It can panic investors and cause market volatility. Floods, earthquakes, drought, mineral discovery, etc., can be some natural factors.
An interesting read: Economic indicators and its love for the stock market!
Types of stock market volatility
Based on the period and calculation, stock market volatility is classified into two types: Implied and historical.
- Implied volatility
These are estimated volatility conditions in the stock market. They may or may not happen in future. It is calculated based on the pricing of option contracts. When the options are quoted at higher prices than their original value, the gap is called option premium.
In the conditions of high implied stock market volatility, the premium for options increases potentially and vice versa. When there is any event lined up in the future, the volatility is high up to its happening.
India VIX accounts implied volatility for the upcoming 30 days, based on Nifty option contracts.
- Historical volatility
As the name suggests, it accounts for past pricing details. It uses methods like standard deviation and correlation to estimate the deviation of a price point from the mean of past prices. The higher this deviation, the more volatility in the market.
Stock market technical indicators like moving averages, Bollinger bands, and average true range use historical volatility.
Calculation of stock market volatility
Understanding stock market volatility is incomplete without understanding the base of calculation.
- Volatility index
It is one of the easiest techniques to measure stock market volatility. These are special indexes which consider option contracts of a key market index. They base their calculation on the price movement of derivatives. The option premium is directly correlated with market volatility.
The Volatility Index (VIX) was introduced by the Chicago Board of Options Exchanges (CBOE). They provide licences to particular stock markets to use the VIX index. In India, they have issued a licence to the National Stock Exchange (NSE). Therefore, India uses India VIX to gauge the volatility in the market based on Nifty options. Market sentiment is visible in the movement of Nifty VIX.
- Beta
It is a highly technical method to calculate volatility with the use of statistics, but it is simplified these days by the use of instruments like Excel and Google Spreadsheets. The beta is a systematic risk or market risk. It calculates volatility for the portfolio by taking the base of a prominent index like Nifty 50 or BSE Sensex.
One of the ways to calculate beta is by correlation. One can determine the correlation between a stock/portfolio’s returns, and the benchmark index’s return. If it is more than 1, the stock is said to be volatile compared to the market index. If it is less than 1, the stock has less volatility compared to the market index.
- Standard deviation
It is one of the most popular techniques to calculate stock market volatility. In this, past pricing details of a stock are used to determine an average price. On this basis, the deviation of the stock price from the derived average is known as the standard deviation. The variation also helps stock traders determine the breakout, support, resistance, etc., prices for stock.
- Technical indicators
Stock market traders usually use certain indicators to mark different price levels, while trading in the short term. They gauge historical price volatility. Some of the famous technical indicators to calculate stock market volatility are as follows:
- Bollinger bands – bands around the moving averages.
- Keltner channel indicator – It uses either price movement and support or resistance level.
- Average true range (ATR) – determines price gaps during the fluctuations.
- Donchian channel indicator – employs high, middle and lower lines on the historical price movement data.
Tips to manage stock market volatility
The price volatility in the market can affect investors adversely. However, it is not inevitable and can be managed with some stock market volatility tips. Here is a short list of measures to mitigate this risk:
- Determine your financial goals and risk appetite to decide on a comfort zone.
- Actively manage your portfolio and stay aligned with market happenings.
- Stock market volatility is short-term. Therefore, without making haste, investors can stay invested during such times.
- Diversify in different assets/stocks with low correlation with each other. It will help absorb potential shock from volatility.
- Keep the provision for such risk in the form of emergency funds.
- Do not make impulsive decisions. One should consult their financial advisors.
Check this out! Risk tolerance and investment strategy
Summary
The stock market is an entity run partially by investor’s confidence and emotions. When the perspectives of buyers and sellers clash, the stock market turns volatile. This volatility is an inherent and significant part of the stock market.
Understanding the same can help investors prepare for uncertainty up to an extent. Stock market volatility can be calculated in different ways. Moreover, investors can also follow some stock market volatility tips to avoid sudden market panics.
FAQs
- Is volatility bearish or bullish?
Investors regard highly fluctuating prices as the condition of volatility. It happens when the perspective and estimations of buyers and sellers. Usually, when there is high selling pressure, it is regarded as volatile conditions. Therefore, bearish markets experience volatility.
- Is low VIX good or bad?
India Volatility Index (VIX) indicates the investor’s confidence in the Nifty options contract. It gives a number to expected volatility in the market over the next 30 days. A low VIX indicates lower volatility risk in the market. Moreover, it shows an opportunity for market confidence and stability.
- How is volatility calculated in the stock market?
Stock market volatility is calculated in different ways, such as standard deviation and beta, volatility index, and technical indicators. The standard deviation helps determine the historical price movement of how much the market is deviating from its average. Moreover, beta can help ascertain systematic market risk and volatility compared to a benchmark index. The volatility index is also used to determine implied volatility in future.
- How to identify volatility in the stock market?
Stock market indicators can help investors identify the potential or implied volatility in the stock market. Technical indicators, along with analysis of price movement, can seek signs of market volatility. Moreover, one can check indexes like India VIX to understand market volatility in the upcoming 30 days. High India VIX indicates lower stability and vice versa.
- How to mitigate stock market volatility risk?
Volatility is an inherent part of the stock market and cannot be eliminated. However, by following certain tips, investors can manage it. Measures like appropriate diversification, informed decision-making, active management, creation of provisions, etc., can help investors hedge their investments from the harsh effects of stock market volatility.

