The symmetrical triangle chart pattern is one of the many tools used for the technical analysis of securities in the stock market. While there are tools like the average directional index to measure the strengths of trends, how do you analyse the market when there is no trend?
This is where the symmetrical triangle plays a role, as it deals with a situation where the market is neither bullish nor bearish. It helps in understanding how the market was before moving sidewards and also helps in making buying and selling decisions when the stocks break out.
Resistance and support in technical analysis
When the market is bearish, prices of securities keep falling due to high supply and low demand. When the prices fall too low, buyers/bulls see this as an opportunity to invest in such shares to make profits when prices increase.
This leads to an increase in demand for such securities, thereby stopping the prices from falling further. This point, where prices stop falling, is called Support.
Similarly, when the market is bullish, prices keep increasing because of high demand to buy. When securities reach high prices, sellers decide to sell because their target prices are achieved. This creates an increase in supply and controls further rise in prices.
This point, where prices stop rising is called Resistance.
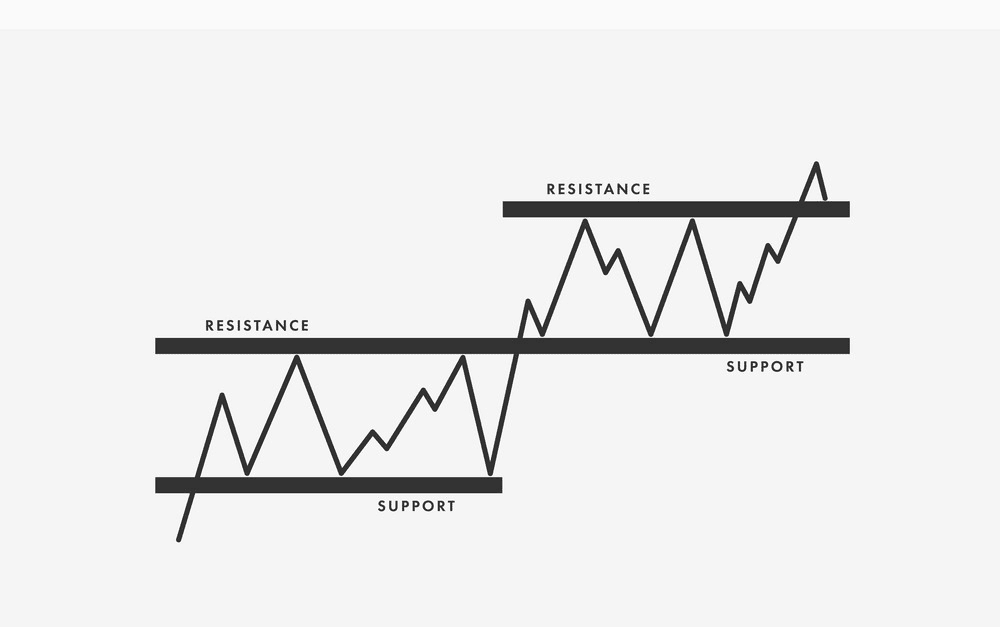
Breakout or breakdown
After the prices reach support and resistance points, they do not fluctuate much for a specific period. The prices are close to each other creating a situation where both bullish and bearish markets are not trending.
You may also like: The ABCs of stock market: Consolidation and Breakouts
Once the stock breaks either of these price points and moves out of support or resistance points, creating a downtrend or uptrend, respectively, it is called Breakout or Breakdown.
Lower highs and higher lows
Lower highs and higher lows are price points at which securities close.
When the security closes at a high price today, but that high is lower than the previous day’s high price at the time of close, it is called lower high.
When the security closes at a low price today, but that low is higher than the previous day’s low price at the time of close, it is called higher low.
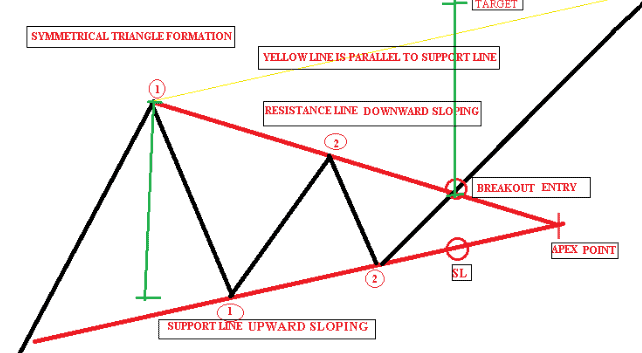
Formation of the symmetrical triangle
A minimum of 4 price points is required to form a symmetrical triangle – 2 points each representing high and low closing prices.
These points should follow the higher lows and lower highs trend to form a symmetrical triangle.
A trend line is drawn to join a high point and a lower high point, forming the upper line of the triangle, which is the Resistance.
Another trend line is drawn to join a low point and a higher low point to form the lower line of the triangle, which indicates the support line.
The point at which these two triangles meet is called the Apex.
Both lines of the triangle should have near-equal slopes to form a symmetrical triangle.
Also Read: Discover the falling wedge pattern – your key to smarter trading
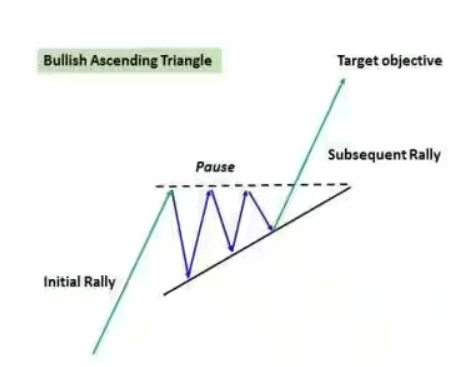
Bullish symmetrical triangle
A continuation pattern, where the market is in an uptrend before the formation of the triangle, indicates a bullish market. Once the triangle is made, no trend takes dominance. After a certain period, when the stock breaks out, it again takes an upward trend, i.e., it breaks out from the resistance line on top, indicating the continuation of a bullish market trend.
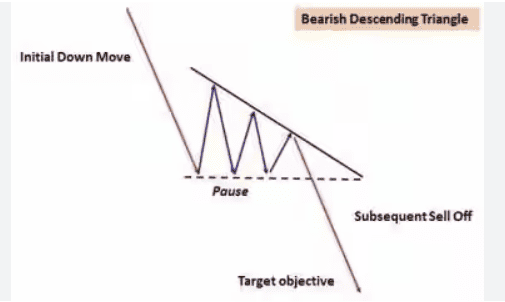
Bearish symmetrical triangle
This is also a continuation pattern where the market is in a downtrend before the formation of the symmetrical triangle, indicating a bear market. After the prices stop fluctuating too much, a symmetrical triangle is formed without any trend in the market. Once the bears take over, the stock breaks out of the support line and continues its downward trend towards the bottom of the chart. This indicates the continuation of a bearish market trend.
What does a symmetrical triangle indicate?
A symmetrical triangle indicates either of the two situations:
- Buyers and sellers are not aggressive in their positions. Thus, there is no uptrend or downtrend in the market.
- Neither of them can dominate the market because of equal pressure from both sides. Hence, the prices are moving sideways, i.e., there is no massive rise or fall in the stock price.
Symmetrical triangle pattern in trading
Target Price – This is the future price of the stock at which the trader wants to buy/sell shares to maximise profits.
Stop Loss – This is a predetermined price point where the trader decides to close a trade to limit losses.
Entry Point – This is where the trader wishes to buy or sell securities.
Exit Point – Where the trader takes an exit by selling securities.
In an upward symmetrical triangle:
- Entry Point – Once the stock breaks out and rises above the previous high, traders enter to buy.
- Stop Loss – The low price point just before the break out is the price for Stop Loss.
- Target Price – The height or distance between the two lines at the beginning of the triangle is added to the breakout point to determine the symmetrical triangle pattern target price.
In a downward symmetrical triangle:
- Exit Point – Once the stock breaks down and goes below the previous low.
- Stop Loss – The high price point just before breaking down.
- Target Price – Similar to an uptrend triangle, the only difference being the direction. The target price in an upward triangle is at the top, whereas it is at the bottom of the chart in a downward triangle.
Also Read: A comprehensive guide to reversal candlestick patterns
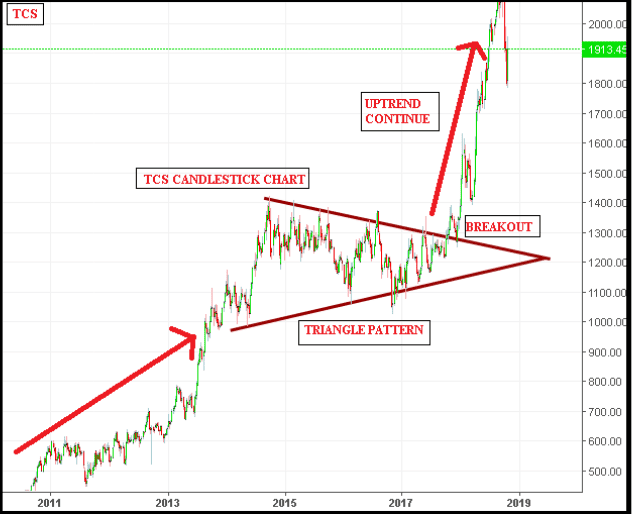
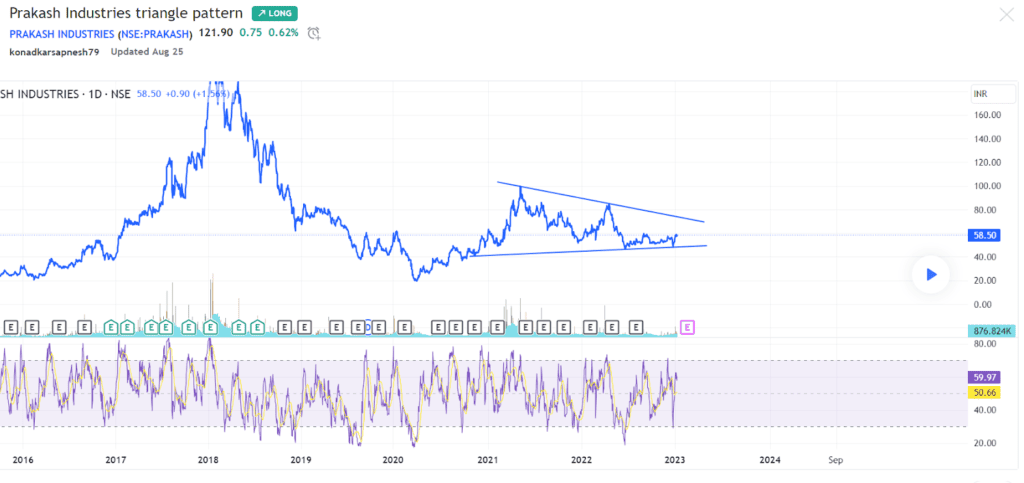
Case study
Below is the example of Prakash Industries as of 25 Aug 2023, showing a bullish symmetrical triangle pattern:
Bottomline
Like the other indicators, the symmetrical triangle is also a tool that helps in analysing and predicting movements but is not an assured sign of how the prices of securities will fluctuate.
While this helps assess the entry, exit and stop loss points, the triangle pattern may vary for different traders as each may assess price points in unique ways.
This tool is very helpful in maximising rewards and reducing risks.
It takes a lot of practice for traders to analyse these indicators thoroughly until which time there may be misinterpretations. Hence, indicators like the symmetrical triangle offer better results when combined with other tools available for technical analysis.