Success in swing trading relies on accurately reading shifts in price action. Timing is crucial, and the ability to interpret potential trend changes can make or break a trade.
Technical tools might be useful in this situation as they provide a deeper understanding of market dynamics. In the upcoming sections, we’ll explore the most useful indicators that can enhance your swing trading strategy.
Swing trading- What is it?
The approach works to take advantage of short lived market movements with trades lasting anywhere from a few days to a few weeks. Rather than focusing on long term investments, the goal is to profit from rapid shifts in asset values.
To spot potential trades, participants rely on technical analysis, including chart patterns and indicators. By targeting these brief price fluctuations, traders aim to make faster, smaller profits without getting caught in extended positions.
Why use technical indicators for swing trading?
In swing trading, timing is critical. Technical tools offer insights into market fluctuations, enabling traders to act before trends shift. Whether it’s spotting a dip or anticipating a rally, these tools signal when to enter or exit trades.
Each metric brings a distinct perspective. Some gauge trend strength, while others assess price volatility or momentum shifts. This variety helps traders navigate short-term price changes with greater accuracy.
Without these analytical methods, decisions might rely too much on instinct. Leveraging technical signals enables more precise actions, minimising risk and potentially enhancing returns.
Also read: Technical Analysis Tools in Share Market
Best technical indicators for swing trading
Technical indicators are applicable to a variety of markets including stocks, indices and foreign exchange for swing traders. The following are some often used indicators:
Moving average
A moving average/ MA simplifies price trends by smoothing short-term fluctuations, making it easier for swing traders to spot broader market direction. It averages prices over periods like 20, 50 or 200 days, offering a clearer perspective on long-term movement.
Traders use crossover strategies to identify shifts. When a fast-moving MA cuts above a slower one, it suggests upward momentum. A decline may be imminent, though, if the faster average falls below. These moments allow traders to anticipate possible reversals in market trends.
Volume
In swing trading, volume is an essential indicator that shows the strength behind price moves. A surge in market activity reveals whether there is significant buying or selling interest, confirming the direction of a movement.
If a price surge is accompanied by increased activity, the momentum is likely genuine. However, if prices break higher without much participation, the move may lack sustainability and could reverse.
Divergence between price and traded quantity offers another insight. When prices drop but activity remains flat, it suggests weakening selling pressure. Observing these shifts can help traders time entries and exits more precisely.
Relative strength index or RSI
The indicator helps swing traders measure the momentum of a market. Its value falls between 0-100, meaning that a number below 30 indicates an oversold situation, whereas one beyond 70 indicates an overbought state.
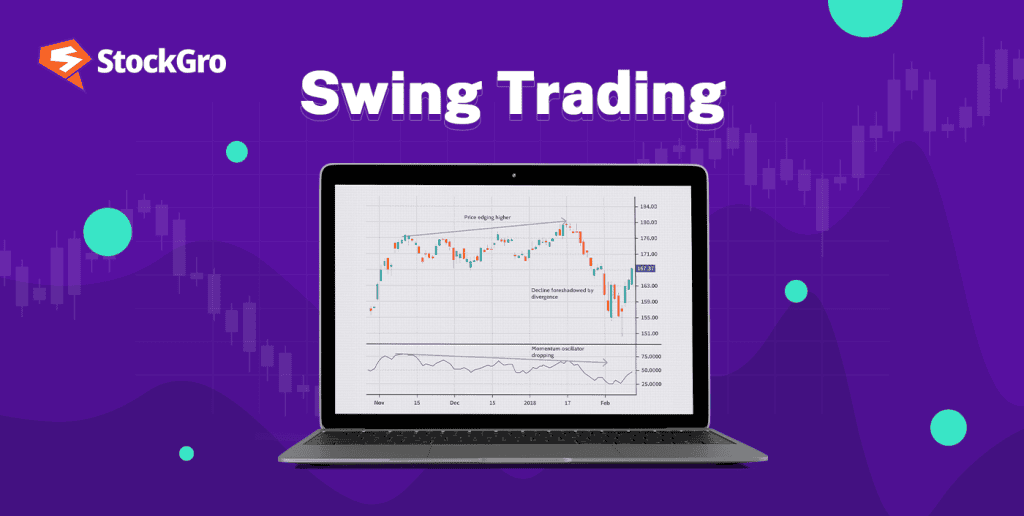
A divergence between price action and RSI can be a red flag. A weakening trend may be indicated if the market keeps rising but the index starts to decline. Conversely, when the index moves up as the market drops, it could signal a recovery is likely.
Stochastic oscillator
By comparing a stock’s most recent closing level to its range of highs and lows over a given time period, it displays numbers ranging from 0-100. When readings rise above 80, the asset is often considered overbought; a drop below 20 suggests oversold conditions.
This tool differs from others by using two distinct components: %K and %D. The first tracks real-time market movement, while the second, a smoothed average, offers a more stable reading. A crossover between these two often hints at a possible shift in direction.
For instance, if %K falls below %D near the 80 mark, a downtrend might be developing. A climb above %D close to 20 on the other hand might signal the start of an upward trend.
Ease of movement (EOM)
The tool combines volume with price action to show how smoothly an asset moves. Positive numbers indicate an upward trend, while negative values indicate a downward tendency, as it oscillates around a zero line. This helps traders see if a market is moving easily in one direction.
When the indicator rises, it shows minimal resistance in price increases. A dip below zero suggests that prices are declining smoothly. However, if an upward move lacks volume support, it might indicate weakening buying pressure.
Swing traders use this tool to track shifts in market momentum and evaluate the ease with which prices move. By understanding these subtle changes, they can better plan entry and exit points based on how strongly the market is moving.
Moving average convergence divergence-MACD
It compares two exponential moving averages/ EMAs (typically a 12-day and a 26-day) to reveal the market’s direction. The difference between these averages forms a line that fluctuates around a baseline.
When this line rises above the central point, it suggests upward momentum, while a move below can signal a bearish trend. Another key feature of MACD is the signal line, which is a 9-day EMA. When the main line crosses above or below the signal line, traders interpret these moments as buy or sell opportunities.
Support & resistance
Support is a point where downward movement tends to halt due to increased buying interest. Resistance, on the other hand, marks a level where upward momentum weakens as selling pressure builds.
A breakthrough at either of these points can signal a shift in market dynamics. For instance, if an asset crosses a previous ceiling, that point might then become a new foundation for further growth.
Traders use these areas to time their moves effectively. Buying near support can offer an opportunity to enter at lower prices, while selling near resistance allows traders to exit before a potential reversal. Large, round numbers often act as psychological markers, influencing market behaviour and adding another layer of insight.
Also read: Mastering renko charts: Strategies to improve your trading
Common mistakes to avoid
- Relying solely on technical signals: While useful, technical signals can be misleading without considering broader financial factors. Keep an eye on market dynamics for better accuracy.
- Overcomplicating analysis: Adding too many tools to your chart can clutter the view and hinder decision-making. Stick to a focused approach with a few reliable methods.
- Forgetting to manage risks: Having a well-thought-out exit strategy is essential. Without one, even minor downturns can lead to significant losses, regardless of your chosen strategy.
- Overlooking momentum shifts: It’s essential to track shifts in asset movement patterns, as failure to do so can result in missed opportunities or poorly timed trades.
Also read: Understanding tick in trading and its role in securities markets
Bottomline
Precision and adaptability are crucial for swing traders. Some of the best indicators for swing trading as listed above, offer valuable insights, but relying solely on one approach can limit your strategy. Combining various methods, while staying flexible to shifting trends, helps improve decision-making. The key is to remain focused, avoid unnecessary complexity, and stay prepared for evolving conditions.
FAQs
- Which technical indicator is best for swing trading?
There isn’t one “best” technical indicator for swing trading. It depends on the trader and the market. Some use Moving Averages to track trends. Others prefer RSI for spotting overbought or oversold conditions. Volume helps confirm the strength behind price moves. MACD is popular for identifying momentum shifts. Each tool serves a unique purpose. The key is finding the combination that works for your strategy.
- Does technical analysis work for swing trading?
Technical analysis can be helpful for swing trading. It lets traders identify trends and patterns in price movements. Some use it to find the right time to buy or sell. Others rely on it to gauge momentum or market strength. It doesn’t work the same for everyone, though. Results depend on the tools used and how they’re applied. Many traders combine it with other methods for better accuracy.
- How do you use a swing indicator?
To use a swing indicator, first choose one that fits your strategy, like RSI or MACD. Look for signals that show trend direction or momentum changes. If an indicator shows overbought, it might be time to sell. If it shows oversold, it could be a buying opportunity. Many traders watch for crossovers or divergences to confirm their decisions. You’ll need to combine these signals with your judgement for better results. Every indicator works differently, so practice is key.
- Is swing trading profitable?
Earnings from swing trading can vary. Some people capture quick gains, while others face losses when the market moves unpredictably. Profit isn’t always certain. The right strategy, good timing, and careful risk management are crucial. Market conditions and how well you use technical tools also play a role. While many traders find success with experience, outcomes can differ widely based on personal approaches. Patience and discipline are key to improving results over time.
- How do you predict swing trades?
Swing trades are often identified by using technical indicators like RSI, moving averages, or MACD. Some traders focus on spotting price patterns to find good entry or exit points. Overbought or oversold conditions can signal potential reversals. Volume analysis can reveal the strength behind a price move. Combining several tools gives a better chance of catching the right moment.

