In the market, tiny price changes can have a big impact. Traders need to grasp these shifts to make informed choices. A key factor that influences this is tick size. It affects when and how trades are executed.
Curious to know more? Let’s uncover its role in shaping decisions.
Tick in trading-What is it?
A tick is the smallest step a security’s price can move. It’s a tiny change, but it matters. Let’s say the minimum price move is ₹0.05. If a stock’s price is ₹100, the next price it can hit is ₹100.05. It can’t be ₹100.01 or .02.
Why does this matter? Well, the smallest increment shapes how trades happen. Exchanges decide the size of this move based on the security. For traders, this impacts how they set buy or sell orders. A smaller price step can make it easier to trade, giving more flexibility.
In tick trading, each step counts. Traders focus on these minute shifts, trying to profit from even the smallest changes. It’s all about timing and accuracy. The faster a position is taken, the better the chance to profit from fleeting opportunities others might miss.
For example-Scalping. It is one of the widely used approaches. It relies on taking advantage of slight differences between the buying and selling points, with quick in-and-out trades. Many now employ automated systems to make rapid decisions, executing trades within milliseconds.
These price shifts also help in determining profit margins and loss limits. Traders base their strategies on these tiny increments, carefully balancing potential gains and risks. In volatile times, tick increments assist in navigating sudden fluctuations, while in quieter markets, they capture smaller, steadier shifts.
Though small, the tick guides every move, helping traders seize opportunities in both fast-paced and calm market conditions.
How tick trading works?
Tick size is determined by the stock exchange and depends on the instrument. For example if it is stocks, company’s market size can be a determinant. Larger companies may have a larger tick size, while smaller ones have a smaller increment.
If a stock’s current value is ₹250 and the tick in share market is ₹0.05, the bid-offer table might look like this:
| Bid Quantity | Bid Value | Offer Value | Offer Quantity |
| 1,000 | ₹249.95 | ₹250.05 | 2,000 |
| 1,500 | ₹249.90 | ₹250.10 | 2,500 |
| 2,000 | ₹249.85 | ₹250.15 | 1,500 |
In the table, you’ll notice the best buying amount is ₹249.95, not ₹250, even though the last traded value is ₹250. This happens because nobody is looking to buy at ₹250. The quantity available there is zero, so that number is skipped.
Something similar occurs on the selling side. The highest selling amount is ₹250.05 instead of ₹250.10. Why? Because no one is selling at ₹250.10. When no quantity is available at a specific amount, it simply gets passed over. You’ll only see values where actual buying or selling activity is happening.
You may also like: Beginner’s Guide: How to Use Stock Market APIs for Investing
Key characteristics of tick size
- Precise value shifts: A tick sets the smallest possible change in a security’s value.
- Varies by asset: Different financial instruments—stocks, futures, currencies—each have their own predefined tick. The rules vary, making the smallest movement unique to every market.
- Controlled by regulators: Exchanges and authorities like SEBI–Securities & Exchange Board of India–define these increments. This ensures a structured environment where changes remain predictable and orderly.
- Affects liquidity: The size of the tick can influence liquidity. Smaller movements might lead to more trades and tighter differences between buying and selling. However, if it’s too minimal, it may create excess volatility.
- Adjustable when needed: It isn’t set in stone. Regulators can modify these increments to reflect shifting market conditions. Adjustments keep the system flexible and efficient.
- Impacts trader behaviour: Even minor movements can trigger significant reactions. Traders may interpret these shifts as buying or selling signals, making the tick a hidden force in driving market sentiment.
Also read: Technical Analysis Tools in Share Market
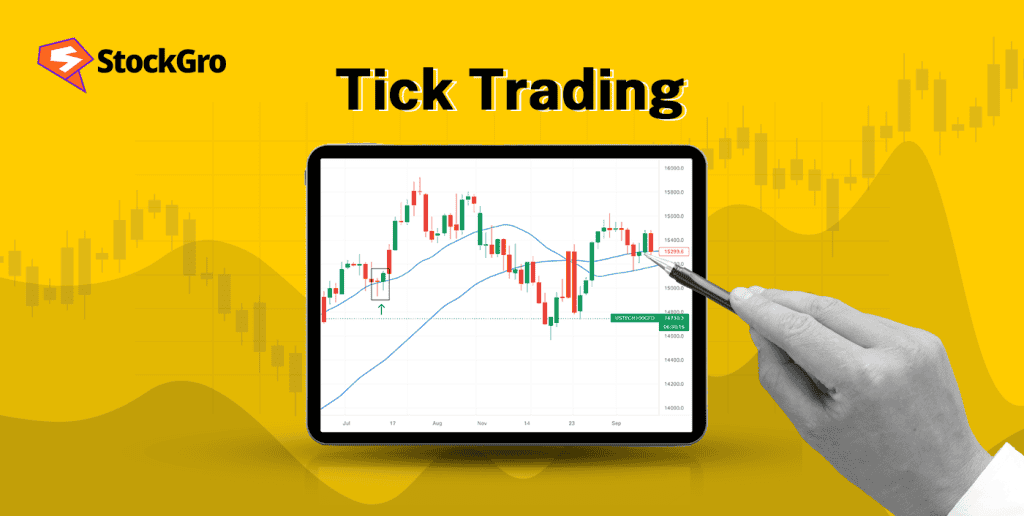
How to read a tick chart?
Tick charts display changes based on the number of trades, not time. The smallest shift in value, called the tick, influences how these charts are read. This is essential for traders to identify trends more easily.
Key steps to read a tick chart:
- Track movement
Each section on the chart forms after a certain number of trades. The tick defines the minimum change you’ll observe. For example, if it’s ₹0.05, each shift will follow this increment. - Identify patterns
Look for shapes like triangles or channels. These can signal potential market shifts. The tick filters out unnecessary noise, making patterns more visible and easier to interpret. - Observe section height
The size of each segment shows how much value has changed. Taller sections mean larger shifts. The minimum change affects this as well—larger ticks result in fewer but more significant moves, while smaller ones show more frequent activity. - Modify tick value
You can adjust the number of trades needed to form each section. Use smaller values in faster markets for more detailed insights. In calmer markets, larger values help smooth out minor fluctuations.
Tick and tick charts work together. Understanding both allows you to grasp changes in value more effectively and make informed decisions.
You may also like: Mastering renko charts: Strategies to improve your trading
Bottomline
The smallest allowed price shift plays a significant role in shaping market activity. It affects how positions are entered and exited, helping traders optimise their strategies. By analysing charts based on these movements, investors can gain clearer insights.
FAQs
- How much is 1 tick in stocks?
In India, the smallest price change a stock can make is called a tick. For instance, if it’s ₹0.05, a stock priced at ₹80 could change to ₹80.05 or ₹79.95. The size varies based on asset or exchange regulations.
- What is tick to trade?
A tick is the smallest price change a security can make during trading. It helps traders understand how prices move and influences their buy or sell decisions. Tick size can vary depending on the stock or market. It plays a crucial role in determining trade execution and timing.
- What is tick data in trading?
Tick data in trading provides detailed records of every price movement in a security. It includes information such as time, price, and volume for each transaction. Traders rely on this information to track market activity, identify trends, and make quick, informed decisions based on real-time fluctuations.
- What is a tick in a trading example?
A tick represents the tiniest shift in a stock’s value. It’s a minimal change, but it can be important. For example, if a stock’s tick is ₹0.01, it can move up or down by that amount. Traders pay close attention to these movements, as they help decide when to enter or exit a trade. Even a slight change can influence decisions.
- How are ticks calculated in trading?
Ticks are the smallest adjustments in a stock’s value. SEBI and the exchange set this amount. It varies from asset to asset. These small movements help traders figure out the right moments to buy or sell. Each shift shows how the market is moving.