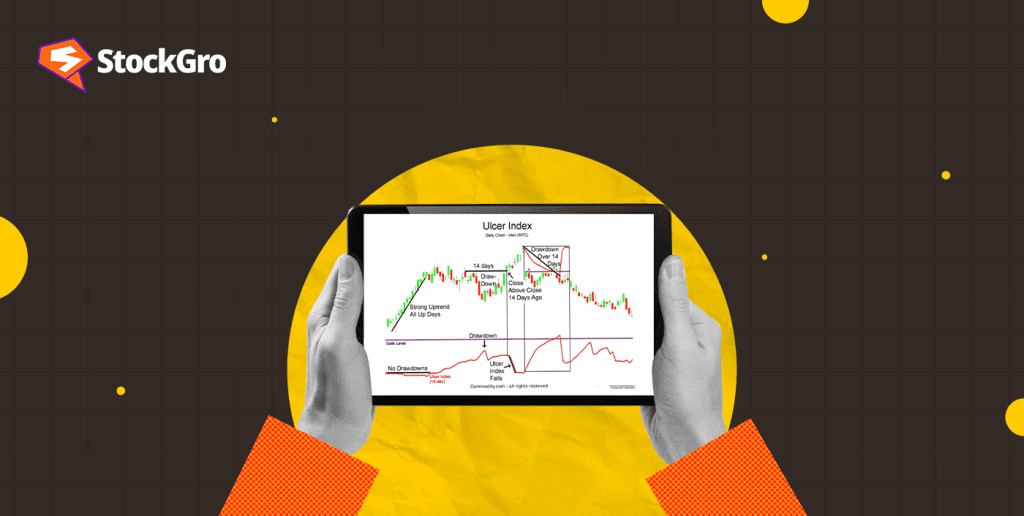
To determine the degree of panic and anxiety in the markets, traders employ a variety of metrics. The standard deviation of returns and the volatility index (VIX) are a couple of these metrics. The ulcer index is one such indicator that is used to determine market volatility.
In this article, we will study the ulcer index, how it is calculated, and how to interpret it.
Also read: Here’s how you can use the MACD indicator
What is the ulcer index?
The Ulcer Index measures the risk of a stock by measuring its downside volatility. In 1987, Peter Martin and Byron McCann introduced the ulcer index in their book “The Investors Guide to Fidelity Funds”. This index measures the downside risk an investor faces when buying a stock. This index measures the maximum potential for loss a stock position bears in volatile market conditions.
This index measures only the downside volatility. Standard deviation, on the other hand, measures volatility whether that might be upward or downward. Since most investors take long positions, they accept upside surprises. It is the unpredicted downside surprises that give them anxiety or ‘stomach ulcers’. Hence, the name Ulcer index.
Also read: What is trend analysis? [Explained]
How to calculate the ulcer index?
We will understand the ulcer index calculation process step by step with an example. Although the default setting of an ulcer index is 14, we will take a 2-period time frame for ease:
Step 1: Percentage drawdown is calculated first using the formula –
Percentage drawdown =
[(Closing price today – Highest closing past 2 days)/(Highest closing past 2 days)] * 100
This formula uses the price at which the stock closed today, that is the closing price and the highest close in the given period, here the highest close market recorded in the past two days.
Step 2: In this step, we will calculate the average sum of squared drawdowns, meaning we will take the percentage drawdown (calculated in the last step) for today and square it.
Similarly, we will square the percentage drawdown for yesterday and square it. Next, we will find the average of the two. (Here, we are using two for ease of understanding, but any period can be used, the default being 14, so the same calculations will be done for the last 14 days)
Squared average = [(Drawdown Day 1)^2 + (Drawdown Day 2)^2] / 2
Step 3: The ulcer index is calculated by finding the squared root of the ‘squared average’
Ulcer index = (Squared average) ^ 0.5
Example: Let us understand the ulcer index formula more easily by an example.
Closing prices – Day 1: $100; Day 2: $95; Day 3: $90 (we will assume day 3 as today and so on)
First, we will find the percent drawdown for day 3 (using day 3 and day 2) and for day 2 (using day 2 and day 1).
Percentage drawdown for day-3 = [(90 – 95) / 95] * 100 = -5.26%
Percentage drawdown for day-2 = [(95 – 100) / 100] * 100 = -5%
Next, we will calculate the squared average,
Squared average = [(-5.26)^2 + (-5%)^2] / 2 = 26.325
Now, Ulcer index = (26.325) ^ 0.5 = 5.13%
How to interpret the ulcer index?
In the example above, a value of 5.13% suggests that the stock will show a downside of not more than 5.13% on Day 4. This is very little data to draw a definite conclusion. A more accurate picture of downward risk can be obtained with data for at least 14 periods (default). Higher values of the ulcer index would suggest that a higher downside risk exists. Values close to zero would implicate lower downside risk.
A point to note here is that if the daily data was opposite, say instead of 100, 95, and 90. It was 90 on day 1, 95 on day 2, and 100 on day 3, the value for the ulcer index would have been zero. (Try to calculate it!)
This index also works well for markets as a whole by calculating the ulcer index for market indices. If you get a value closer to zero, that would mean markets are somewhat stable, investors are less worried and values greater than zero would imply some worry amongst investors.
The ulcer index can also be used as a contrary indicator, meaning that very high values can suggest the index might reverse soon. For example, if an investor observed that every time in the last year the ulcer index for a stock crossed the value of 10%, it reversed. They might use it for new positions when it crosses the 10% level.
Also read: Technical Analysis Tools: Uses, and Examples Explained
Bottomline
The Ulcer index can be a good gauge of market volatility. Its calculation is simple and the best part is you do not have to calculate it yourself. Most modern charting software already has this as an indicator. So, now you know the workings of this index and how to interpret it you can start building strategies around it.
Remember, do not use the ulcer index independently. Use it alongside other indicators since the volatility factor alone is not enough to take trading positions. Also, backtest the strategy and understand its risk profile before putting real money at risk. This index has not been backtested on recent markets and does not guarantee performance or profits.
FAQs
1: What is the ulcer index?
The ulcer index is a technical indicator that measures the risk of a stock by calculating its downside volatility. This index was created in 1987 by Peter Martin and Byron McCann. This index tells how much a stock will likely fall in volatile market conditions.
2: Can the ulcer index be used in trading?
It is wise not to use the ulcer index independently while trading since many other factors influence a stock other than its volatility. However, it can be used in conjunction with other indicators only after thorough risk analysis and backtest.
3: What is the difference between ulcer index and standard deviation?
Standard deviation measures the volatility of a stock. It does not differentiate between the upside and downside volatility. The ulcer index measures the downside volatility because that is what concerns the traders. So, the ulcer index can be considered better than the standard deviation.
4: How to interpret ulcer index?
Ulcer index values range from zero to infinity. A value of zero means that the markets are moving upwards and chances of downside risks are low, but a value greater than zero means that a downside risk exists. It can also be interpreted as a contrary indicator very high values can indicate reversal.
5: Can the ulcer index be used in the forex market?
Ulcer index is calculated using high and close data of the last n number of periods. So, the ulcer index can be used in any market where these data are available whether that might be forex, cryptocurrency, stocks, etc. after backtesting and risk analysis.

