Stock investors use bollinger bands to spot market patterns. John Bollinger devised these bands in the early 1980s to measure market volatility and price changes. They define high and low pricing to assist traders make market-based decisions.
High volatility widens the bands, suggesting price changes, and low volatility contracts them. The sensitive bollinger bands help traders optimise investment plan entry and exit points.
Bollinger bands assist traders gauge market volatility and price levels. The upper and lower bands are standard deviations, while the middle band is a simple moving average (SMA). Volatility increases trading possibilities, whereas contracting bands lessen volatility and induce breakouts. Traders can enhance their techniques with other technical indicators by monitoring price interactions with the bands to find overbought and oversold levels.
What are bollinger bands?
A price chart with three Bollinger bands helps traders assess market volatility and identify price reversals. John Bollinger devised this indicator to produce a dynamic price range using a moving average and standard deviation. This lets investors make market-based trading decisions.
Components of bollinger bands
| Component | Description |
| Middle band | The asset price’s SMA over a predetermined period. |
| Upper band | SMA + 2 standard deviations, indicating potential overbought conditions |
| Lower bands | SMA -2 standard deviation, indicating potential oversold conditions. |
Illustration and interpretation of bands
The top and bottom bands of a Bollinger Bands image vary with asset volatility, while the SMA is the centre band. When it approaches the upper band, the price may imply overbought conditions, suggesting a selling opportunity.
A buying opportunity may exist at the bottom band due to oversold prices. Narrower bands indicate lesser market volatility than wilder ones.
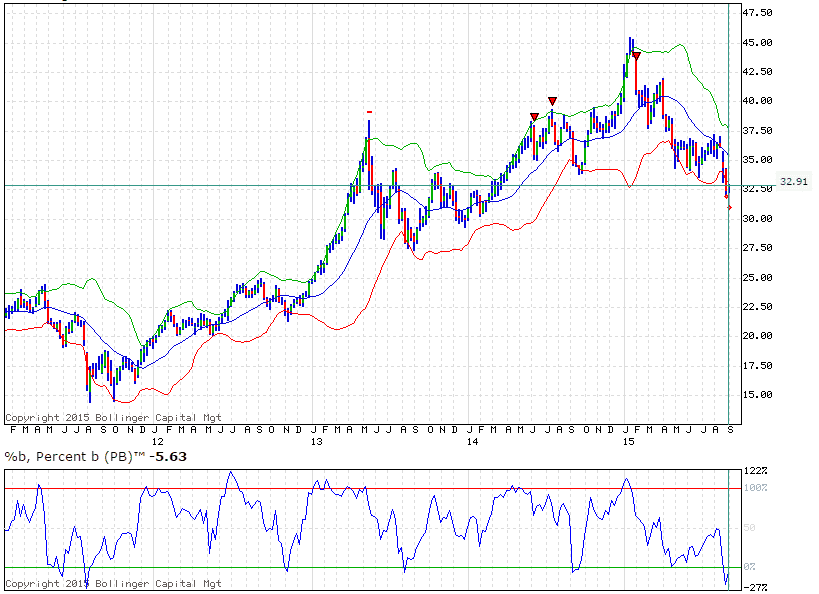
The bollinger band diagram above depicts SMA, upper, and lower bands. The middle band displays the trend, while the upper and lower bands show overbought and oversold.
Price touching top band suggests selling opportunity, while price contacting bottom band signals purchasing opportunity. Narrower bands suggest less market volatility than wider bands.
Examples of various market conditions
- Bullish market: Prices consistently contact or hover near the upper band, indicating strong upward movement. Trading opportunities may arise when the price retraces to the middle band, signalling strength.
- Bearish Market: Prices often touch the bottom band during bearish trends, signalling a sharp decline. Prices rebounding off the upper range may indicate bearish trend retracements, prompting traders to sell.
- Sideways market: Sideways markets have fluctuating prices. Trading ranges are defined by buying near the lower band and selling near the higher band.
Importance of bollinger bands in trading
Bollinger bands are trading tools for assessing market volatility. Traders utilise the distance between the upper and lower bands to estimate market activity. Widening bands increases volatility and the likelihood of big price changes. As volatility drops, contracting bands signal price consolidation.
Bollinger bands help spot price reversals, breakouts, and volatility. When the price hits the top band, traders may sell due to overbought conditions. However, bottom band contact suggests an oversold market with buying chances. The ability to spot turning points helps traders refine entry and exit strategies and make informed decisions.
Furthermore, combining bollinger bands with additional indicators improves trade accuracy. Bollinger bands, relative strength index, and moving averages may strengthen confirmation signals . This multimodal technique helps traders filter out false signals, improving trading selection dependability. In general, bands are an important tool in a traders armoury since they provide vital insights into market dynamics and improve the effectiveness of trading techniques.
Setting up bollinger bands on trading platforms
Here is the step-by-step guide on adding bollinger bands to trading charts
| Action | Details |
| Open your trading platform | Launch your preferred trading platform |
| Select the chart of the asset | Choose the stock or asset you wish to analyse. |
| Access the indicators menu | Look for the “Indicators” or “Studies” section in the platform’s menu. |
| Find for Bollinger bands | Type “Bollinger Bands” in the search section or locate it in the list. |
| Add Bollinger bands to chart | Click to add the indicator to your chart. |
| Adjust settings if necessary | Open the settings menu for Bollinger Bands to customise parameters. |
| Save settings and implement modifications | Verify the settings and implement the modifications to the chart. |
Adjusting parameters (period and standard deviation) for individual trading styles.
| Parameter | Default setting | Adjustment guidance |
| Period | 20 | Adjust for trading style: 10 days for day trading, 50 for swing trading. |
| Standard Deviation | 2 | Standard deviation can be modified based on market volatility: use 1.5 for less volatile assets or 2.5 for more volatile markets. |
Developing a bollinger bands strategy
- Trend following strategies
- Buying at the lower bands during uptrends: In a bullish market, prices frequently retrace to the lower band, creating an opportunity to buy. Using this strategy, the price is expected to rise again. Volume rises and other technical indicators can help traders close deals.
- Selling at the upper band during down trends: In a bearish market, prices may approach the upper band before reversing. This presents a potential selling opportunity. Traders can sell when the price meets or exceeds the upper band, which is supported by bearish indicators or volume surges, in order to maximize returns while minimising risk.
- Reversal Strategies
- Identifying overbought and oversold conditions: Bollinger bands alert traders to probable reversals by indicating overbought (upper bands) and oversold (lower band) conditions. A price contact on the top signals an impending market correction, whilst a touch on the lower bands indicates a possible comeback.
- Using candlestick patterns for confirmation: To improve accuracy, traders can seek candlestick patterns that confirm the reversal indications from the bands. Patterns like hammers or shooting stars in the top band can signify a sell signal, whilst bullish engulfing patterns in the bottom band can confirm a purchase.
- Volatility breakout strategies
- Trading breakouts beyond the bands: Breakouts happen when the price swings beyond the upper or lower bands, suggesting strong market momentum. Traders might take positions in the breakout’s direction, anticipating further movement. Due to false breakouts, market circumstances must be monitored.
- Managing risk and setting stop-loss orders: When using breakout strategies, it is critical to effectively control risk. To protect themselves from adverse price fluctuations, traders should place stop-loss orders just beyond the opposite band. This strategy provides for profit maximisation while limiting potential losses.
How This Indicator Works
Bollinger Bands are designed to adapt to market conditions by adjusting their width based on volatility. They are dynamic, meaning they expand when the market is volatile and contract during periods of low volatility. The middle band is the simple moving average (SMA), which represents the price’s average over a defined period, typically 20 periods. The upper and lower bands are positioned a set number of standard deviations above and below the SMA. Price movements within the bands are typical, but when price reaches the outer bands, it often signals a potential reversal or continuation of a trend.
Components of Bollinger Bands
- Middle Band (20‑period SMA): This is the average price over the last 20 periods (days, hours, etc.). It represents the base from which the upper and lower bands are calculated.
- Upper Band: It is derived by adding a multiple of the standard deviation to the middle band. It acts as a level of overbought conditions or a potential resistance.
- Lower Band: It is calculated by subtracting the same multiple of standard deviation from the middle band, acting as a level of oversold conditions or potential support.
The standard deviation is used to account for volatility — wider bands indicate high volatility, while narrower bands indicate low volatility.
How to Calculate Bollinger Bands
Bollinger Bands are calculated using the following steps:
- Step 1: Calculate the 20‑period Simple Moving Average (SMA) of the stock’s closing prices.
- Step 2: Compute the standard deviation (SD) of the 20-period prices. Standard deviation measures how much the price varies from the average. A higher standard deviation means more volatility.
- Step 3: Multiply the standard deviation by a factor, typically 2, to get the distance between the middle band and the outer bands.
- Step 4: Add this value to the SMA for the upper band, and subtract it from the SMA for the lower band.
Formula of Bollinger Bands
- Middle Band = 20‑period SMA
- Upper Band = 20‑period SMA + (2 × Standard Deviation)
- Lower Band = 20‑period SMA − (2 × Standard Deviation)
The multiplier (2) can be adjusted depending on the trader’s preference for sensitivity. A larger multiplier makes the bands wider, while a smaller one makes them narrower.
Example of Bollinger Bands
Imagine a stock with a 20-day SMA of ₹200 and a standard deviation of ₹10:
- Upper Band = ₹200 + (2 × ₹10) = ₹220
- Lower Band = ₹200 − (2 × ₹10) = ₹180
In this case, the upper band is ₹220, and the lower band is ₹180. When the price reaches or exceeds these bands, it could indicate overbought (near the upper band) or oversold (near the lower band) conditions.
Bollinger Bands Trading Strategy
1. Bounce Play:
This strategy is used in sideways markets. When the price touches or moves outside the lower band, it may indicate that the stock is oversold, creating a potential buy signal. Conversely, when the price touches the upper band, it may indicate overbought conditions, suggesting a sell signal.
2. Squeeze Breakout:
The “squeeze” happens when the bands narrow, indicating low volatility. When the price breaks out of the narrow range, it can lead to significant price movement. The direction of the breakout is often the direction of the upcoming trend, making this a popular strategy for traders who capitalize on volatility shifts.
3. Riding the Bands:
In a strong trending market, the price often “rides” the band. In an uptrend, prices will move near or along the upper band, while in a downtrend, they will move near or along the lower band. Traders use this strategy to identify whether the trend is continuing or weakening.
Which Indicator Works With Bollinger Bands
Bollinger Bands work best when combined with other indicators to confirm signals:
- RSI (Relative Strength Index): RSI helps determine if an asset is overbought or oversold. Pairing RSI with Bollinger Bands can offer a more comprehensive view—e.g., if the price touches the lower Bollinger Band and RSI shows an oversold condition, it strengthens the buy signal.
- MACD (Moving Average Convergence Divergence): The MACD can confirm momentum, which can help traders make more informed decisions about trend reversals or breakouts when combined with Bollinger Bands.
- Volume Indicators: Volume confirms the strength of a breakout. When price breaks out of the bands with high volume, it signals a higher probability of a strong trend.
- Moving Averages: Using short-term and long-term moving averages alongside Bollinger Bands can help identify trend direction and the strength of the breakout.
Use of Bollinger Bands
Bollinger Bands are used in various ways:
- Trend Reversal: When price hits the upper or lower bands, it can indicate that the price is reversing.
- Overbought/Oversold Conditions: Prices near the upper band indicate overbought conditions, while prices near the lower band suggest oversold conditions.
- Breakouts: A breakout from the bands often signals a new trend or continuation of the existing trend.
- Volatility Measurement: Bollinger Bands can also be used to assess market volatility, with expanding bands showing higher volatility and contracting bands signaling lower volatility.
Limitations of Bollinger Bands
- False Signals: In sideways or range-bound markets, prices can repeatedly touch or move outside the bands, leading to false signals.
- Lagging Indicator: Since Bollinger Bands use past prices to calculate the bands, they can sometimes lag the current price action.
- Not Always Predictive: Bollinger Bands only react to market conditions and don’t predict future price direction.
Risk of Bollinger Bands
- Whipsaw Risk: In volatile, choppy markets, prices may often bounce off the bands without following through in a clear trend, leading to whipsaws.
- Over-Dependence: Relying solely on Bollinger Bands for trade decisions can be risky. Always combine them with other indicators for better accuracy.
- Excessive Breakouts: Some breakouts from the bands may not lead to sustained price moves, so traders should be cautious about entering trades based solely on a band breakout.
Common mistakes to avoid when using bollinger bands
When using bollinger bands, several typical errors can lead to poor decision-making and misinterpretation.
Misinterpretations of signals caused by market volatility are a significant inaccuracy. Market volatility can mask bollinger bands signals, causing traders to perceive price variations as trends. Price action should be considered in the context of market conditions to avoid erroneous signals that could lead to hasty entry or departure.
Another common problem is relying too much on bollinger bands in the absence of further indicators. Although they provide useful insights into volatility and probable price reversals, their use alone can lead to inadequate analysis. The use of additional indicators such as RSI or moving averages, increases accuracy and provides a more complete picture of market conditions.
Lastly, ignoring the context of larger market movements might be harmful. Misguided trades me occurs as a result of ignoring market activity and focussing on bollinger bands. speculators, for example, may face severe losses if they buy in the lower band during a severe downtrend.
To maximise the likelihood of a successful transaction, it is critical to examine the current market direction and ensure that bollinger band signals are consistent with broader trends. Being aware of these typical risks allows traders to design well-informed strategies and most successfully use bollinger bands
Conclusion
To summarise, bollinger bands provide major advantages in stock trading by revealing market volatility and potential price reversals. Their ability to recognise overbought and oversold levels and signal breakouts helps traders enhance their tactics. Personal trading success requires constantly creating and improving these approaches, combining bollinger bands with indicators and being aware of market tendencies. Trading in a dynamic environment is more successful when traders make informed decisions.
FAQ’s
What are bollinger bands and how do they work?
Bollinger bands are a technical analysis tool with a simple moving average central band and two standard deviation-derived outside bands. Contraction bands suggest less market volatility, whereas expansion bands signal increasing volatility. They help traders spot overbought or oversold levels, which can signal price reversals or breakouts.
How do I set up bollinger bands on my trading chart?
Choose the asset chart on your trading platform to set Bollinger bands. Add “bollinger bands” to the chart from the indicators menu. Period (20) and standard deviation (2) can be changed. When you apply the modifications, bollinger bands will appear which help you with your technical analysis.
What do upper and lower bollinger bands indicate?
Price over the upper Bollinger band indicates overbought circumstances and a potential selling opportunity. An oversold position and a buying opportunity occur as the price approaches the lower band. Band spacing predicts market volatility, with larger bands indicating higher volatility and smaller bands lower volatility.
Can bollinger bands be used in all market conditions?
Indicators make Bollinger bands more relevant in many market circumstances. While they provide information on volatility and probable price reversals, traders should also evaluate larger market patterns and dynamics. In strong trending markets, depending simply on bollinger bands may result in erroneous signals, thus combining them with other technical analysis tools is recommended for increased accuracy.
What are common strategies for trading with bollinger bands?
Traders often follow trends by buying at the lower band during uptrends and selling at the upper band during downtrends. Reversal methods indicate overbought and oversold conditions, sometimes supported by candlestick patterns. Furthermore, volatility breakout methods entail trading when prices cross the bands while limiting risk using stop-loss orders to defend against adverse swings.
Who Created the Bollinger Bands Indicator?
John Bollinger created the Bollinger Bands indicator in the 1980s. He designed it to measure volatility and identify overbought or oversold conditions in the market using standard deviations.
Bollinger Bands Strategy for Swing Trading
- Buy near the lower band: When the price touches or dips below the lower band in a sideways or uptrend.
- Sell near the upper band: When the price touches or exceeds the upper band in a sideways or downtrend.
- Look for squeezes: Tight bands indicate low volatility; a breakout often follows.
- Confirm with other indicators: Use RSI or MACD for stronger signals.
What is the Use of Bollinger Bands?
- Volatility Measurement: Wide bands = high volatility, narrow bands = low volatility.
- Overbought/Oversold Signals: Price near upper/lower bands suggests overbought/oversold conditions.
- Trend Direction: Price near the upper band signals bullish momentum, near the lower band indicates bearish momentum.
Bollinger Bands Strategy for Intraday
- Squeeze: Watch for narrow bands indicating low volatility and breakout opportunities.
- Scalping: Buy at the lower band in an uptrend, sell at the upper band in a downtrend.
- Reversal Play: Combine with candlestick patterns for potential reversals.
- Confirm with momentum indicators: Use RSI or MACD for confirmation.