Introduction
In trading, moving averages are a fundamental technical indicator that offers a concise approach to smoothing price data and identifying trends. Understanding what is a moving average in trading is critical for traders seeking to predict market trends and decrease risk.
These indications help traders make strategic judgments in volatile markets where entry and exit signals are required. The article below discusses trading strategies employing moving averages in unstable markets.
Know more about: NSE considers extending trading hours
What is a moving average in the share market?
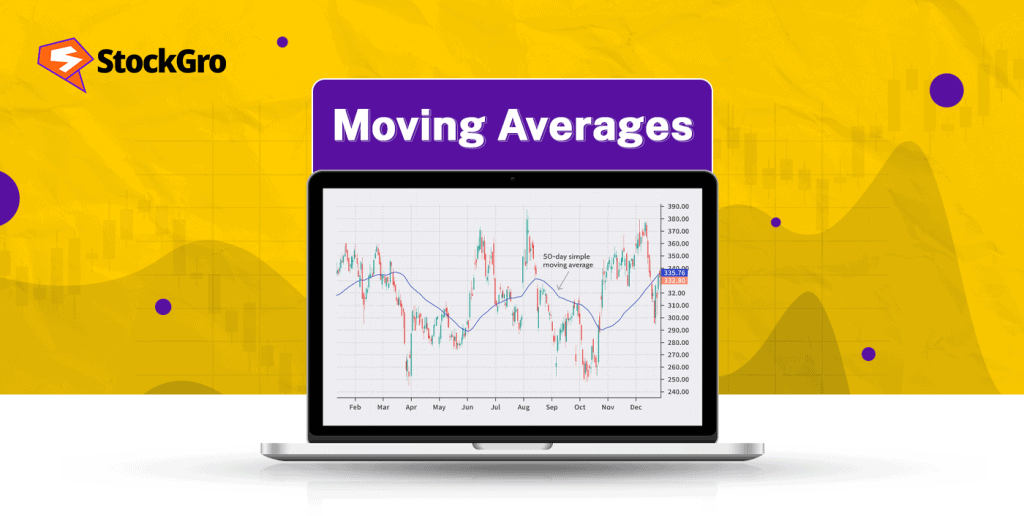
Moving averages help traders assess the market’s trend by eliminating short-term price swings and market noise.
It is a tool that averages past stock prices, helping to smooth pricing data and identify trends.
A simple moving average (SMA) calculates the average price over a period to simplify the market. Because it emphasises recent data points and is more adaptable to sudden market movements, exponential moving average (EMA) is often utilised for short-term trading.
The graph above shows that the exponential moving average (yellow line) reacts faster to price changes than the simple moving average.
Traders use moving averages to spot trends and track market movement. These tools help traders find entry and exit positions in volatile and trending markets, making decisions more informed.
Learn more about : What is EMA in the stock market?
Key types of moving averages
Simple moving average (SMA)
A simple moving average (SMA) is a technical indicator that calculates a security’s average price over a period by weighting all data points equally. It helps identify long-term market patterns and smooth price volatility.
Computation of simple moving average (SMA)
- Calculated by aggregating the price data over predetermined period (eg: 50 days, 200 days)
- It is a popular choice for long term analysis because of its straightforward approach and ability to generate distinct trend signals.
- Frequently used by long term investors and swing traders to identify more general market trends.
Also know more about: What is swing trading?
Pros vs Cons of SMA
| Pros | Cons |
| Simple to calculate and interpret | Slow to respond to abrupt price fluctuations |
| Provides evident trends by smoothing data | Current market fluctuations are delayed |
| Optimal for analysis of long term trends | Short-term price volatility may be neglected |
Exponential moving average (EMA)
- EMA weights recent prices more, making it more responsive to market fluctuations. It helps traders spot trends faster than SMA, making it ideal for short term trading methods.
- A formula is employed to calculate the EMA, which assigns a greater weight to newer prices and prioritises recent data. This is accomplished through the implementation of the subsequent formula:
- EMA’s focus on recent data helps it adapt faster to price movements, making it useful in fast-moving markets. Due to its sensitivity to recent price fluctuations, it helps traders to profit on intraday chances and capture early trend reversals in short-term trading methods. This responsiveness lets traders make quick, informed judgements in unpredictable markets.
- The EMA is the preferred tool for day traders who are seeking to capitalise on short-term price fluctuations and volatile market conditions due to its capacity to adjust rapidly to price movements.
Contrast between SMA and EMA
- The difference between SMA and EMS stem mostly from their responsiveness and appropriateness. SMA is appropriate for long term or swing trading methods that focus on larger trends since it produces price averages with equal weighting, resulting in a delayed response to short term changes. However, the latency may cause traders to miss early signals.
- EMA, on the other hand, prioritises current prices, making it extremely sensitive and ideal for fast-paced, short term trading such as day trading. While it quickly detects momentum swings, it can also generate false signals in tumultuous markets, necessitating thorough study.
SMMA (Smoothed Moving Average): A refined version of the simple moving average that reduces short-term fluctuations, offering a smoother trend line for better long-term insights.
HMA (Hull Moving Average): Uses weighted calculations to minimize lag and react faster to price changes, making it ideal for active traders seeking timely signals.
AMA (Adaptive Moving Average): Adjusts its sensitivity based on market volatility, becoming smoother during stable periods and more responsive during sharp price moves.
TMA (Triangular Moving Average): Applies double smoothing to price data, giving extra weight to the middle values and producing a very stable, lag-free trend view.
JMA (Jurik Moving Average): A proprietary, ultra-smooth moving average that minimizes lag while filtering out market noise for more precise entry and exit signals.
Arnaud Legoux Moving Average (ALMA): Uses Gaussian distribution and offset parameters to balance smoothness and responsiveness, effectively highlighting short-term trend reversals.
Weighted moving average (WMA) for advanced application
The WMA is exceedingly susceptible to fluctuations in short-term prices, as it prioritises recent prices at an even greater rate than the EMA. Experienced traders typically employ this sophisticated tool to execute intricate strategies. It provides precise signals in markets that are swiftly evolving, but it necessitates meticulous interpretation to prevent false alarms.
Strategic applications of moving averages
In trending markets, moving averages are essential for determining the most advantageous entry and exit points. Traders can confirm their long or short positions when a trend is robust by smoothing price data.
Moving averages are utilised by trend following strategies to confirm these positions, as a price that remains consistently above or below the moving average indicates the continuance of a trend.
Crossovers, such as the golden cross (when a short term MA crosses above a long term MA), which indicates bullish momentum, and the death cross (When a short term MA crosses below a long term MA), which indicates bearish momentum, further bolster decision making.
In bullish markets, MAs assist traders in capitalising on the upward trend by guaranteeing punctual entries. Conversely, in adverse markets, MAs function as indicators for early exits and short selling opportunities.
For example, traders who use the 50 day and 200-day moving averages frequently identify early reversals or continuation patterns in both market conditions, which effectively informs their strategic decisions.
Advanced moving averages strategies
The Death Cross and Golden Cross are effective indicators of market momentum changes. They can predict bullish and bearish trends, but they are lagging indicators and may miss market reversals.
Moving Average Convergence Divergence (MACD) displays the relationship between two moving averages by combining many MAs, improving momentum analysis. It often detects buy/sell signals and trend changes.
MAs are often combined with RSI or Bollinger Bands to eliminate false signals and improve entry and exit locations for sophisticated traders. This multi-layered method improves decision-making and decreases risk in difficult markets.
Challenges and limitations
- Lagging indicator: In fast moving markets, moving averages produce delayed signals as they reflect prior price data. Traders may overlook critical opportunities by entering or exerting positions late as a result of this delay.
- Inefficiency in volatile/sideways markets: In markets that are highly volatile or non-trending (sideways), MAs frequently produce false signals, which result in suboptimal decision making.
- Over reliance: The use of MAs exclusively without taking into account macroeconomic factors, such as interest rates or economic indicators, can distort market analysis and lead to suboptimal strategies.
Conclusion
Moving averages are essential for monitoring market trends, however, they are not perfect. MAs are most effective when combined with other data-driven tools to develop a more adaptive and intelligent strategy.
In order to confidently navigate the intricate trading landscape of today, consider them to be a critical component of the problem.
FAQ’s
- What is the definition of the moving average in trading?
A moving average is a technical indicator that is employed to balance out price data by generating a continuously updated average price over a specific time period. It assists traders in recognising trends by excluding short-term fluctuations. SMA and EMA price momentum indicators are widely used.
- How is the moving average calculated?
SMAs are calculated by adding as asset’s closing prices over a specific number of periods and dividing by that number. The more complex EMA calculation prioritises recent values to improve responsiveness to new information. Both techniques highlight pricing patterns and uniformity, making them valuable tools for trend research in trading strategies.
- What is the difference between SMA and EMA?
The main difference is recent price weighting. The EMA prioritises recent values, making it more responsive to market fluctuations, whereas the SMA weights all prices equally during the designated period. EMA is more effective for short-term trading, whereas the SMA is used for long-term analysis.
- How do moving averages help traders?
Moving averages flatten price data to reveal the trend, thereby aiding traders in identifying buy or sell signals. Furthermore, they possess the capacity to track market momentum. By employing crossovers like the golden cross and death cross, traders can determine the most advantageous entry and exit points in both rising and declining markets.
- Can moving averages be used for analysing alone for trading decisions?
Moving averages can identify patterns, but they are lagging indicators and should not be used alone. A sophisticated trading strategy including technical indicators like RSI or bollinger bands and fundamental analysis works well. This blend helps traders to make more accurate and informed selections in a variety of market scenarios.

