India holds the prestigious title of being one of the world’s foremost cultivators of cotton and jute. It proudly claims the position of the world’s second-largest silk producer, with an astounding 95% of the planet’s handcrafted textiles originating from India. The nation’s textile exports are on an upward trajectory, projected to hit a remarkable $65 billion by the fiscal year 2026.
Cradled in the bustling textile hub of Bhilwara, Rajasthan, BSL Ltd. is a shining emblem of India’s storied textile legacy. Since its inception in 1971, the company has intricately interlaced itself into the very essence of the industry, crafting a narrative of ingenuity and excellence that resonates worldwide.
On the 20th of May, 2024, BSL Ltd unveiled its financial performance for the concluding quarter of the fiscal year. This article seeks to provide an insightful examination and thorough analysis of the BSL Q4 results and financial outcomes.
About BSL Ltd
BSL Ltd., a beacon of excellence in the textile industry, has been adorning the world with its exquisite fabrics since its inception in 1971. With a legacy rooted in Bhilwara, Rajasthan, the company has flourished into a global entity, renowned for its diverse range of high-quality textile products.
From synthetic and worsted yarns to sophisticated suitings and plush furnishing fabrics, BSL’s offerings encapsulate the essence of innovation and craftsmanship. The company’s commitment to quality is evident in its expansive production capabilities, which include a robust infrastructure of 178 looms and a spinning capacity of over 29,000 spindles.
This formidable production prowess enables BSL to craft over 288 lakh meters of fabric annually, catering to a wide array of national and international markets. With a focus on sustainability and technological advancement, BSL ensures that each meter of fabric not only meets but exceeds the stringent ISO 9001-2008 standards.
BSL’s global footprint is marked by its role as a leading supplier to the retail giant IKEA and its presence in over 25 countries across South Asia. The company’s excellence has been recognised with more than 30 prestigious awards, a testament to its unwavering dedication to performance and innovation.
At the core of BSL’s success is a team of 2,500 skilled professionals, whose expertise in financial, marketing, and technical domains weaves together to create a tapestry of success and growth. As pioneers in the textile manufacturing sector, BSL’s vertically integrated unit is a marvel of modern technology. Equipped with state-of-the-art machinery sourced from around the globe, the company’s facilities span a sprawling 45-acre campus.
The market cap of BSL Ltd is ₹185.26 crores as of May 30, 2024. This is the shareholding pattern of the company, as of March 31, 2024:
BSL Q4 and FY24 result financial highlights
Let’s look at a few of the key highlights revealed in the quarterly results of the company:
- For the fourth quarter of the fiscal year 2024, BSL Ltd’s operational revenue was recorded at ₹156 crores, marking a significant 31.7% growth from the previous year. However, this was an 8.6% dip from the preceding quarter.
- Throughout the fiscal year 2024, the company’s operational revenue saw a substantial 41.3% rise, totalling ₹667 crores, up from ₹472 crores in the fiscal year 2023.
- The company’s EBITDA for the fourth quarter stood at ₹16 crores, which is a 27.6% increase from the same quarter last year, despite a slight 8.2% reduction from the last quarter. The EBITDA margin for this period was 10.5%.
- For the entire fiscal year, EBITDA reached ₹65 crores, climbing from ₹51 crores in the previous year. The EBITDA margin for the year was 9.8%, a small decrease from the 10.9% margin of fiscal year 2023.
- The Profit After Tax (PAT) for the last quarter of FY24 was ₹2.5 crores, down from ₹3.9 crores in the third quarter and ₹3.8 crores in the last quarter of the previous year. The PAT margin for the quarter was 1.6%.
- For the full fiscal year 2024, the PAT was ₹11 crores, which was lower than the ₹17 crores reported in FY23, resulting in a PAT margin of 1.7%.
- The board has sanctioned a dividend distribution of ₹1.0 per share, which equates to a 10% dividend on the face value of ₹10 per share.
You may also like: Prestige Estate Q4 results: Mixed outcomes and new dividend proposal
BSL Ltd’s quarterly performance
Here are the key financial metrics reflecting the company’s quarterly performance in relation to the previous quarter:
| Q4 FY24(₹ crores) | Q3 FY24(₹ crores) | Change(%) | |
| Revenue | 156.34 | 171.00 | -8.57 |
| Operating profit | 16.41 | 17.89 | -8.27 |
| Profit before tax | 3.00 | 5.13 | -41.52 |
| Net profit | 2.52 | 3.92 | -35.71 |
| EPS | 2.45 | 3.81 | -35.70 |
BSL Ltd’s annual performance
Here are the key financial indicators of the company as compared to the preceding year:
| FY2024(₹ crores) | FY2023(₹ crores) | Change(%) | |
| Revenue | 666 | 472 | 41.10 |
| Operating profit | 65 | 53 | 22.64 |
| Profit before tax | 15 | 23 | -34.78 |
| Net profit | 11 | 17 | -35.29 |
| EPS | 10.91 | 16.43 | -33.60 |
Also read: On track or off the rails? IRCTC’s Q4 earnings and investor sentiment
Market reaction
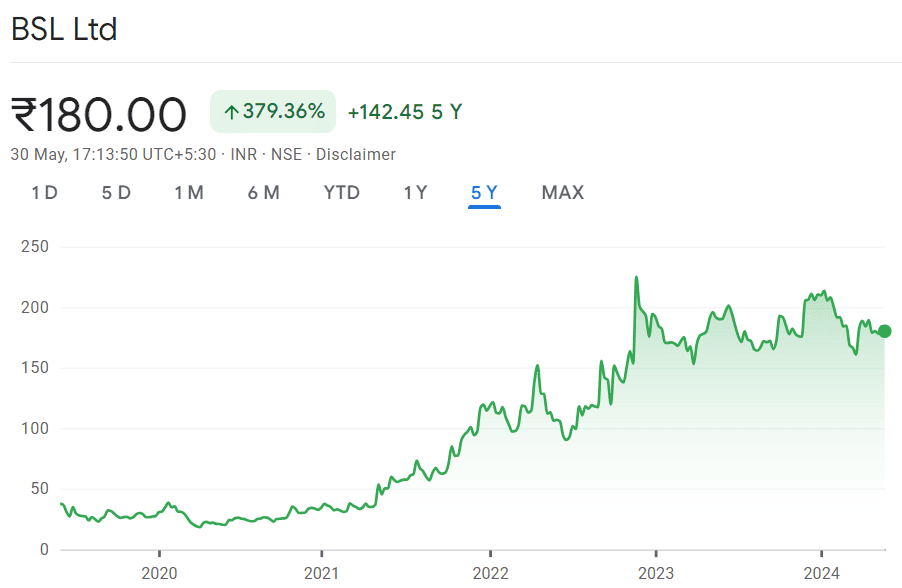
BSL Ltd released its Q4 results on May 20, 2024. On the previous trading day, the shares closed at ₹181.60. After the announcement, the BSL Limited share price fell by over 10% and hit a 52-week low of ₹164.90.
However, on May 23, 2024, the share price eventually recovered and hit a 52-week high of ₹203.00. When looking at the BSL share price history for the past 5 years, the stock has given a return of 379.36%.
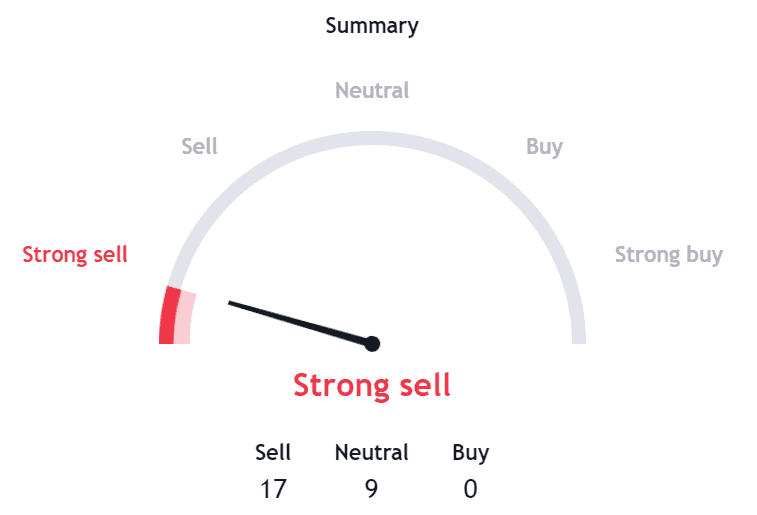
BSL share price target:
According to the technical analysis, BSL shares are given a strong sell rating:
Peer analysis
Let’s compare the key financial ratios of BSL Ltd with that of its competitors:
| Company | CMP (₹) | Market cap(₹ crores) | P/E | Earnings Yield (%) |
| BSL Ltd | 180 | 183 | 16.3 | 7.69 |
| Shahlon Silk Industries Ltd | 21.8 | 195 | 51.6 | 6.30 |
| Mahalaxmi Rubtech Ltd | 210 | 225 | 20.4 | 7.45 |
| Premco Global Ltd | 397 | 131 | 13.0 | 14.4 |
| Veekayem Fashion & Apparels Ltd | 222 | 130 | 32.4 | 6.65 |
| Fiberweb India Ltd | 40.6 | 117 | 16.1 | 6.96 |
Must read: Textile industry in India – The foundation of fashionable clothing trends
Bottomline
BSL Ltd has demonstrated both resilience and growth in a competitive textile industry, anchored by its strong heritage and continuous innovation. Despite the challenges reflected in its quarterly performance, BSL Ltd’s annual results underscore significant achievements and a commitment to excellence.
Market reactions to BSL Ltd’s financial results were initially negative, with the share price falling over 10% post-announcement and hitting a 52-week low. However, the stock demonstrated resilience by rebounding to a 52-week high shortly after, reflecting investor confidence in the company’s long-term prospects.