The first quarter results season is here, setting the stage for an in-depth look at financial giants. On Saturday, 3rd August, State Bank of India (SBI), the largest bank in the nation, disclosed its Q1 results. This blog dives into the specifics of SBI’s latest financial performance.
About SBI
With a history that stretches over two centuries SBI is the oldest financial institution in the country. Headquartered in Mumbai, it remains a cornerstone of India’s banking sector. As of 31st March 2024, the Government of India controls 57.54% of its equity capital–playing a strategic significance.
SBI’s operations extend to corporate and retail clients worldwide. The bank’s services are not limited to traditional banking. Through various subsidiaries and joint ventures, SBI provides investment banking, credit cards, insurance, fund management, broking, and factoring.
Also read: Ten Basic Terminologies That You Should Know About Indian Banking
SBI now
With a vast network of ~22,580 branches and around 63,580 ATMs, it ensures a broad reach across the country. SBI has 26.3% market share of the home loan , 19.6% in auto and is the leader in education loans. In mobile banking, it leads with 26.81% of transaction volumes.
The bank is Government’s favourite banker, handling a turnover of ₹65.55 lakh crore. Its 63% share in central government business and accreditation by 26 major ministries highlight its crucial role in the financial landscape of India.
On the international front, SBI has a significant presence with 241 branches and offices in 29 countries. This global footprint caters to the needs of the Indian diaspora and international commerce.
Also read: The best banks in India: Leading the way in finance
Financial performance- Q1FY25
Profitability
The banker reported a net profit of ₹17,035 crores for Q1FY25, a slight rise of 0.89% compared to the previous year. The operating earnings increased to ₹26,449 crores, reflecting a 4.55% growth. With ROA i.e return on assets @1.10% and ROE- return on equity at 20.98%, the bank’s profitability remains solid.
Net interest income – the difference between interest earned and interest paid– advanced by 5.71%, indicating robust core operations. The overall NIM or net interest margin was 3.22%, with domestic value of the same @3.35%. NIM is a metric that compares the amount of interest paid out to the total amount of assets.
Balance sheet
The bank experienced a 15.39% expansion in credit, with domestic lending up by 15.55%. International branches saw a 14.41% rise in loans, driven by strong performance in SMEs and agriculture. Personal loans for retail clients grew by 13.60% & corporate lending increased by 15.92%. Total deposits climbed by 8.18%, with Current Account and Savings Account (CASA) deposits up by 2.59%. As of 30th June 2024, the CASA ratio was 40.70%.
Asset quality
SBI’s asset quality showed notable improvement. The Gross NPA ratio fell to 2.21%, a decrease of 55 basis points. Net NPAs were reduced to 0.57%. The Provision Coverage Ratio (PCR) stood at 74.41%. The Slippage Ratio declined to 0.84%, and the credit cost was 0.48% for the quarter.
Capital adequacy
The Capital Adequacy Ratio (CAR) was 13.86%, reflecting strong capital reserves. Digital banking adoption continued to grow, with the proportion of transactions through alternate channels rising to 98.2% from 97.5% the previous year.
| ₹ Crores | Q1FY25 | Q4FY24 | QoQ % | Q1FY24 | QoQ % |
| Interest income | 1,11,526 | 1,11,043 | 0.44 | 95,975 | 0.44 |
| Interest expenses | 70,401 | 69,387 | 1.46 | 57,070 | 1.46 |
| NII | 41,125 | 41,655 | -1.27 | 38,905 | -1.27 |
| NIM % (Domestic) | 3.35 | 3.47 | -12 bps | 3.47 | -12 bps |
| Operating profit | 26,449 | 28,748 | -8 | 25,297 | -8 |
| Loan loss provisions | 4,518 | 3,294 | 37.16 | 2,652 | 37.16 |
| Profit after tax | 17,035 | 20,698 | -17.7 | 16,884 | -17.7 |
Source: SBI Q1FY25 Investor Presentation
You may also like: Dabur India’s Q1 FY25 results
SBI share performance
On 5th August, the share price declined by 5.2% to ₹804 on the BSE. This drop followed the bank’s Q1 results announcement and a general market sell-off. By midday, the share price slightly recovered to ₹808 but remained down by 4.7%.
The stock reached a 52-week high of ₹912 and hit a low of ₹543.20 within the same period.
Despite this short-term turbulence, over the past year, they have gained 41.58%.
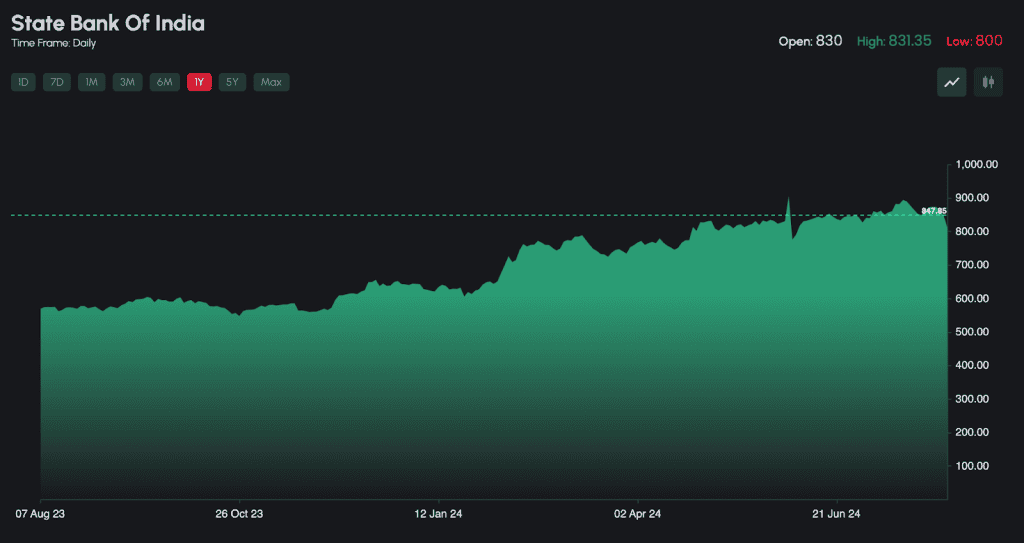
Source: NSE
Looking further back, the five-year return stands at 163.14%.
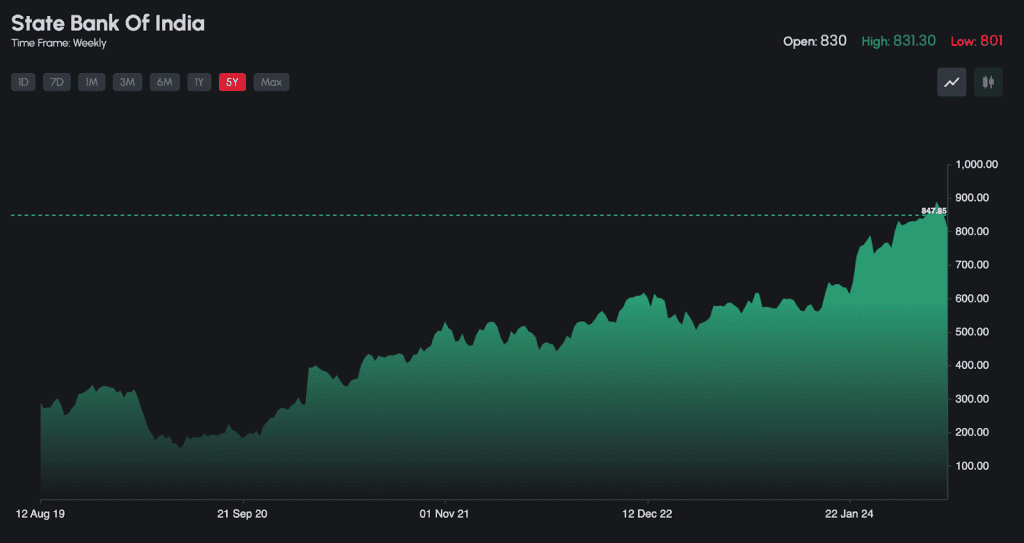
Source: NSE
Bottomline
State Bank of India’s Q1FY25 results reveal a blend of positive developments and challenges. The bank achieved growth in net profit and operating earnings, though the share price experienced some volatility following the results and broader market trends.
Long-term returns continue to be strong, with notable gains over the past year and five-year periods. Asset quality improvements and a robust capital adequacy ratio indicate solid financial health.
Investors may want to weigh the short-term market movements against SBI’s historical performance and strategic importance in the financial landscape. This approach can help in forming a balanced view of the bank’s potential.