Table of contents
Traders use technical analysis tools to identify potential price movements and understand how to capitalise on them.
For technical analysis, candlestick formations stand out for their ability to provide a clear message of approaching trend reversals. One of the powerful candle patterns is the bullish engulfing, with its distinct visual representation.
In this article, you can understand the power of a bullish engulfing candlestick pattern and how to interpret signalled price reversals.
What is the bullish engulfing pattern?
The bullish engulfing is a multiple candlestick pattern, representing a reversal of the ongoing market trend. It appears at the bottom of a downtrend and involves the interplay of two candles.
As the name suggests, an engulfing candle pattern occurs when a candle in a price chart completely engulfs or covers the previous candle. The first candle reflects the recent trend’s colour (red), while the second candle (green) is of the opposite colour and suggests a potential reversal of the ongoing trend.
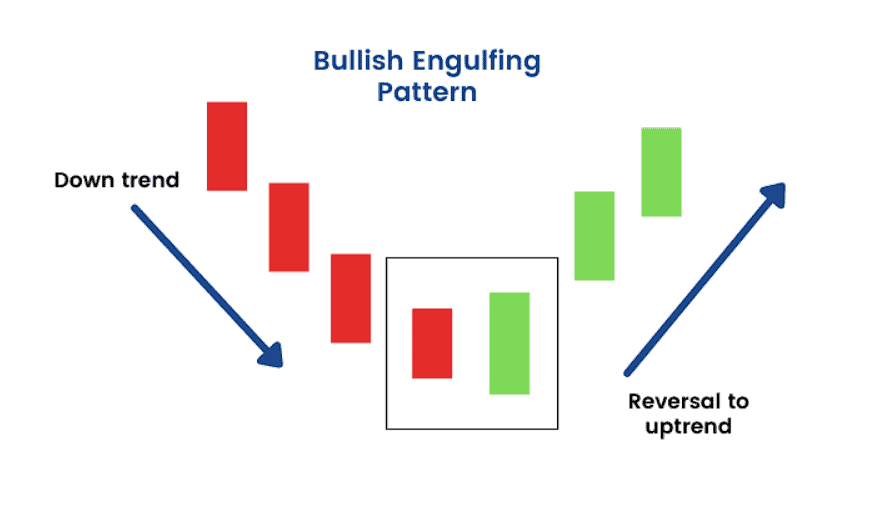
The bullish engulfing candle typically appears after a long downward price trend. This downtrend sets the stage for an approaching trend reversal, indicating reduced selling pressure and a rise in buying pressure. It triggers more buyers to enter the market, leading to a further price rise.
Types of engulfing candlesticks: Bullish vs. bearish engulfing pattern
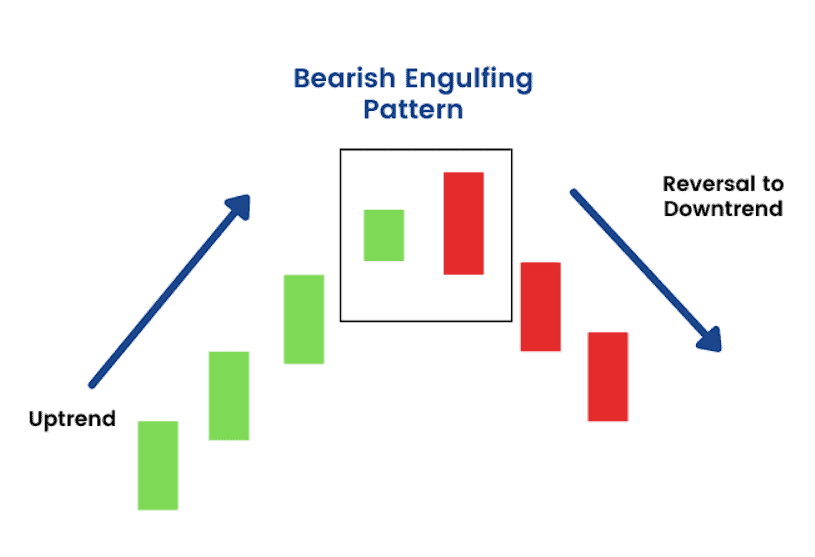
A bearish engulfing pattern signals a bearish reversal that suggests a potential price fall as sellers take charge. This pattern emerges at the top of an uptrend.
This pattern triggers a reversal of the existing trend, prompting an inrush of sellers that drives the price downward.
Components of bullish Engulfing Candle pattern
First candle:
The first or previous candle in the bullish engulfing pattern is the bearish one of a downtrend. This bearish candle indicates that the opening price is higher than the closing price.
Traders look at the body size to get a signal. A large-sized body indicates a significant fall in price during the specified time frame, representing an existing downtrend.
Second candle:
The second candle is bullish in the bullish engulfing pattern. It engulfs the first candle’s body (bearish candle). It means this bullish candle opens lower than the closing price of the first candle.
But, when it closes, it is above the first candle’s opening price. The second candle’s body is typically longer than the first, indicating a significant change in market sentiment.
Interpretation and signals
- Market sentiment: Simply, it can have a huge impact on market sentiment as it can prompt traders to take positions, expecting a price increase. The bullish engulfing pattern illustrates changing market sentiment from a bearish outlook to a bullish one.
A sharp price direction shift represents buyers’ increased control and potentially reversing the existing downtrend. - Candle size for confirmation: The candle size in every candlestick pattern matters and enhances the reliability of the signal. In the engulfing pattern, a larger bullish candle than the prior bearish candle indicates a significant change in prices and a shift in market sentiment.
A large-sized bullish candle represents that buys have significantly overcome the sell, marking a strong bullish reversal.
How to trade a Bullish Engulfing pattern?
As traders recognise a bullish engulfing pattern, they often initiate long positions, buying the asset with the expectation that the price will rise. The pattern’s occurrence suggests holding the securities for future sale at a higher price.
Often, they find a bullish engulfing pattern, a strong signal, when the red candle is a doji or the following candles close above the high of the bullish candle.
Example
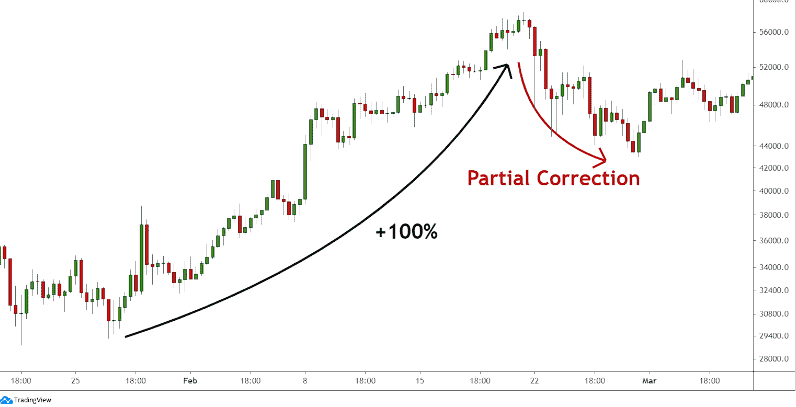
As previously mentioned, the bullish engulfing pattern appears at the end of a downtrend, signifying the potential new uptrend. A trend reversal implies that there is the need for a correction of an upward trend first. In the provided chart, you can observe an upward trend (from January to February) that led to a 100% surge in price.
Chart 1
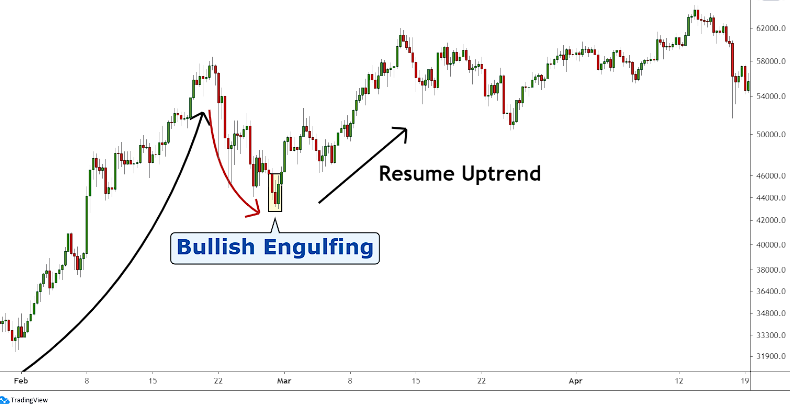
Subsequently, a trigger is required to reignite the previous upward movement. In chart 2, notice how the price swiftly surged after a short-term move against the prevailing trend (partial retracement) on February 28th.
Chart 2
Conclusion
The bullish engulfing pattern is a crucial concept in technical analysis to forecast potential price trends and market shifts based on historical market data.
By recognising this pattern and understanding its implications, traders can stay ahead of their counterparts to benefit from market shifts.
FAQs
A bullish engulfing pattern is considered a buy signal in technical analysis. It occurs when a larger bullish candle fully engulfs the body of a smaller bearish candle from the previous session. This pattern suggests that buyers are gaining control and that the market may be reversing from a downtrend to an uptrend. Traders often use this signal as an indication to enter a long position, expecting the price to increase.
To confirm a bullish engulfing pattern, you should look for a bullish candle that completely covers the body of the preceding bearish candle. This pattern should be accompanied by an increase in trading volume, which indicates stronger buying interest. Additionally, confirming the pattern with other technical indicators, such as the Relative Strength Index (RSI) or Moving Average Convergence Divergence (MACD), can provide further validation of a potential upward trend.
A bullish engulfing pattern is generally seen as a positive signal, suggesting a shift in momentum from sellers to buyers. It is particularly significant when it follows a consistent downtrend, as it may indicate the start of an uptrend. However, it’s important to consider the pattern within a broader market context, as its effectiveness can vary depending on market conditions and should not be relied upon in isolation.
The strongest bullish pattern is often considered to be the cup-and-handle pattern due to its high success rate in signalling a bullish continuation. This pattern resembles a cup with a handle and typically indicates a pause in an uptrend before continuing higher. Other notable bullish patterns include the head-and-shoulders bottom, double bottom, and triple bottom, which also suggest a reversal from a downtrend to an uptrend.
The engulfing pattern is deemed reliable by many traders, especially when it occurs in line with the prevailing trend. The reliability increases with the size of the engulfing candle—the larger it is, the stronger the signal. It’s also more significant when it forms after a clear price decline. However, like all technical patterns, it should be used in conjunction with other analysis methods for the best results.