In the world of stock markets, traders and investors are always looking for tools and indicators that can help them understand the movement of stock charts. A similar tool that has become popular over the years is the money flow indicator (MFI).
Let us dig deeper and understand what the MFI indicator is and how to use it for profitable trading.
What is MFI?
The full form of MFI is the money flow index. It is a technical oscillator that oscillates between 0 to 100. If the MFI goes above 80, it means that the stock is overbought. However, if the MFI goes below 20, it means the stock is underbought.
MFI is similar to another famous indicator, which is the relative strength index (RSI). The only difference is that the money flow index incorporates price and volume data. Due to this, MFI is also referred to as the volume-weighted RSI.
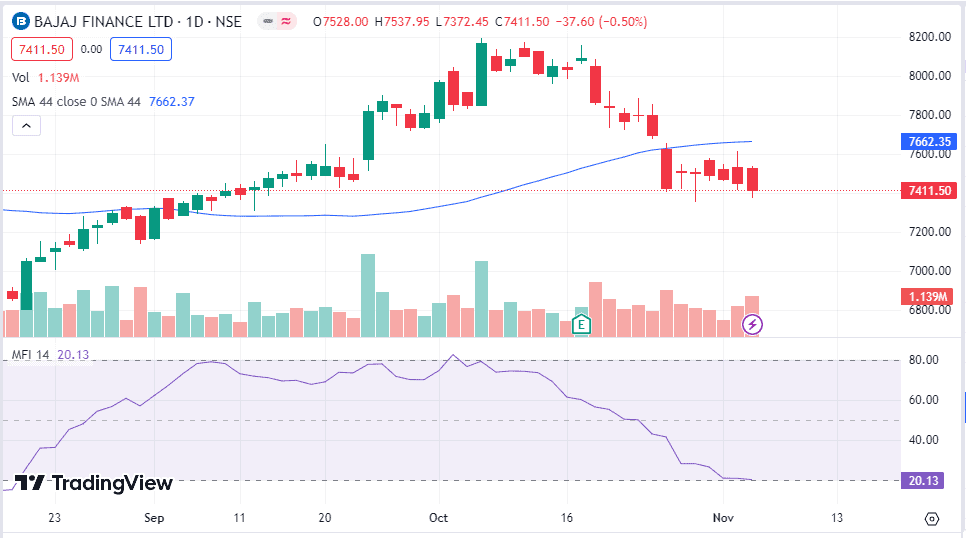
Here, we can see the MFI indicator is at 20.13, meaning that the share is underbought.
You may also like: Investor’s guide to India VIX (volatility index)

Money Flow Index Formula
Ideally, as a trader, you will be adding the indicator on the platform you use for analysing your charts. The MFI is calculated in several steps involving both price and volume data. Here’s how it’s done:
1. Typical Price (TP): The typical price for each trading day is the average of the high, low, and closing prices for that day.
TP = (High + Low + Close) / 3
2. Raw Money Flow (RMF): Multiply the typical price by the trading volume for that day to calculate the raw money flow. This represents the amount of money traded on a given day.
RMF = TP * Volume
3. Money Flow Ratio (MFR): The money flow ratio is calculated by dividing the RMF of up days (when the closing price is higher than the previous day’s close) by down days (when the closing price is lower than the previous day’s close).
MFR = (Sum of 14 periods Positive Money Flow) / (Sum of 14 periods Negative Money Flow)
Positive money flow: The sum of RMF on up days.
Negative money flow: The sum of RMF on down days.
4. Money Flow Index (MFI): Lastly, the Money Flow Index is computed by using the below formula:
MFI = 100 – (100 / (1 + MFR))
Also Read:Understanding the Black Scholes pricing model
Interpreting the money flow indicator
It is essential to understand what the MFI Indicator actually does. Traders and investors can interpret the MFI indicator in the following ways:
1. Overbought and oversold conditions:
Money Flow Index readings exceeding 80 show an overbought condition, implying a potential impending price correction for the asset. Conversely, MFI values below 20 typically signal an oversold state, suggesting that the asset might be undervalued and a reversal is anticipated.
2. Failure of swings/ divergence:
When the Money Flow Index moves in the opposite direction of the price, it’s called divergence. This might indicate a reversal in the prevailing price trend. For example, if an asset is making higher highs while Money Flow Index is making lower highs, it may indicate weakening buying pressure and a potential trend reversal to the downside.
3. Long-term investment into fundamentally strong shares:
When you’re looking to invest in them but are afraid to invest in them, thinking that the shares might be trading at an inflated price. That’s a good time to use the Money Flow Index. If the MFI of the share is at 20 or below, it’s a good time to buy/ increase your position in that asset.
4. Confirming trends:
Like the RSI, Money Flow Index is used to confirm whether the trend is upward, downward or sideways. If an asset is in an uptrend and MFI is also trending higher, it suggests that the buying pressure is consistent with the price movement.
5. Reversal signals:
A sharp drop in Money Flow Index from overbought territory is a signal that a bullish trend is losing momentum, and a reversal might be on the horizon. Conversely, a sudden rise in MFI from oversold conditions can indicate that a bearish trend is weakening, and a bullish reversal may be in the making.
Practical applications of the money flow index indicator
- Swing trading:
Swing traders use the Money Flow Index indicator to identify probable entry and exit points. Traders can use the MFI indicator along with RSI and other technical indicators to understand the right time to buy or sell an asset.
- Risk management:
Investors can use the MFI indicator to assess the overall market sentiment. If Money Flow Index is consistently low, it may indicate a lack of conviction among market participants, leading investors to be more cautious with their positions.
- High volatility trading:
The money flow indicator applies to stocks where the buying and selling of shares is frequent. MFI can help traders assess the strength of buying and selling pressure in various assets. Cryptocurrency can also use Money Flow Index as it is a highly volatile asset class.
Also read: Unlocking the power of index futures: A beginner’s guide
Drawbacks of money flow index indicator
Let’s look at how we can use the Money Flow Index Indicator with caution:
- False signals:
Like many technical indicators, the Money Flow Index can produce false signals, leading to losses if relied upon too heavily. Traders must use this technical indicator alongside other indicators. The success rate of technical indicators should be evaluated by backtesting any strategies.
- Timeframe :
The Money Flow Index is sensitive to the timeframe being used for analysis. It can provide different signals on different timeframes, so traders must select an appropriate time frame based on their trading strategy.
- Market range:
The Money Flow Index may not be able to provide concrete results in all scenarios. In strongly trending markets, it can provide valuable insights, but in sideways or range-bound markets, it may produce less reliable signals.
Conclusion
The money flow indicator is a valuable technical instrument for traders and investors. It offers valuable insights into market sentiment, potential shifts in trends, and the strength of prevailing trends. By understanding how to calculate and interpret the Money Flow Index, market participants can make more informed decisions in the complex world of financial markets.
Remember, there is no single indicator that should be relied upon exclusively. Traders should use the Money Flow Index alongside other technical indicators to improve their stock selection, profitability and success rates. This applies to any other technical indicator that you might be using.

