Table of contents
Unravel the powerful indications of these line graphs and make the right trading choice.
Traders who leverage market patterns make maximum profits and minimise losses. One such tool that helps in analysing the strength of market trends is the ADX indicator.
ADX full form is the Average Directional Index. ADX helps assess whether the current market trend of increasing prices or decreasing prices is strong. Understanding this helps investors analyse the pricing pattern of stocks and determine the right time to buy or sell.
What are the trending markets?
A trending market is a market condition where the prices of a particular stock keep moving in the same direction over a specific amount of time.
When the price of a stock keeps moving upward, the market shows an upward or bullish trend.
When the price of a stock keeps moving downward, the market shows a downward or bearish trend.
There may be some differences in the daily movements, but the average trend of prices during a specific period should follow the same direction in a trending market.
What is the directional movement index?
The directional movement index (DMI) is an essential component in analysing ADX.
Using various price points, DMI suggests whether the market is moving upward (bullish) or downward (bearish)
DMI can be of two types: Positive DI (+DI) and Negative DI (-DI).
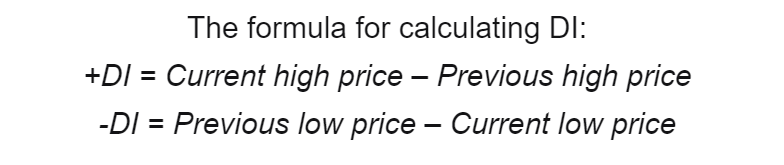
When the difference between the current and previous high prices is greater than the difference between the previous and current low prices, +DI is used, indicating that the market is bullish.
In the opposite scenario, -DI indicates that the market is bearish.
Example:
Let us consider Stock ABC
High as of yesterday: ₹ 25
High as of today: ₹ 28
Low as of yesterday: ₹ 23
Low as of today: ₹25
+DI = 28 – 25 = 3
-DI = 25-23 = 2
Here, the value of +DI is greater than -DI, indicating that +DI is currently stronger, making the trend bullish.
How is the DMI linked to ADX?
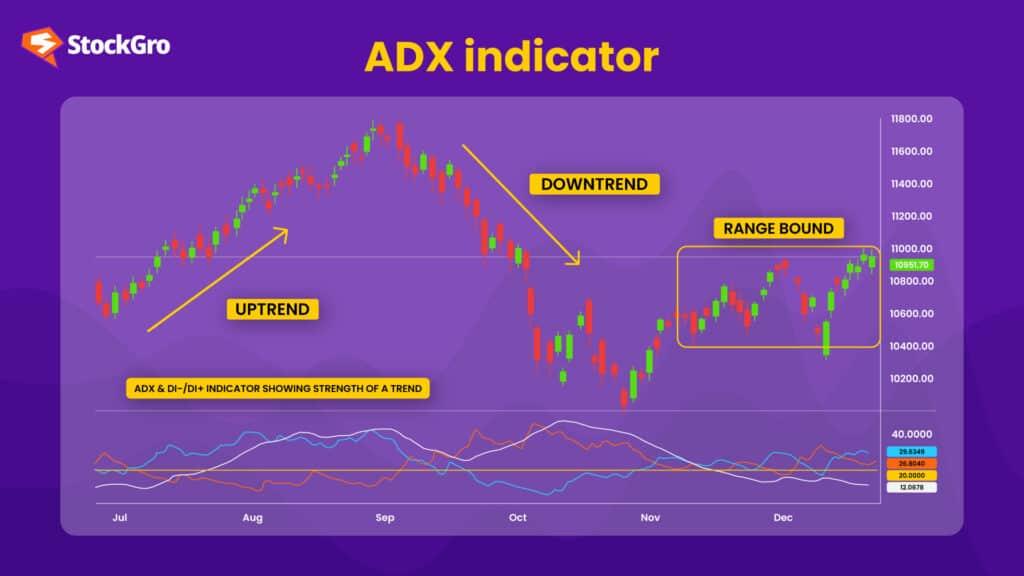
ADX and the DI lines are plotted on a graph, making them easier to comprehend.
When the market is bullish or in an upward trend, the +DI numbers form a line graph on top of the chart. The constant rise in prices indicates a strong trend, and the ADX forms a line close to the positive directional index.
When the market is in a downward trend, the -DI numbers form a line on top, and ADX forms a line close to the negative directional index.
So, based on the directional index that ADX follows on the graph, investors interpret trends in the market.
ADX indicator formula
It requires the calculation of moving averages over a certain period.
- The ADX, is usually computed for 14 days. (Variable as per requirement)
ADX Indicator Formula;
Day 1 = (DX1 + DX2 + DX3…. DX14) / 14
Day 2 onwards: ADX = ((ADX1 * 13) + Current DX)) / 14
Where, DX = (PD Index – ND Index / PD Index + ND Index) * 100
PDI = (Current Day’s High Price – Previous Day’s High Price / ATR) * 100
NDI = (Previous Day’s Low Price – Current Day’s Low Price / ATR) * 100
ATR (Absolute True Range) = Previous ATR (n-1) + True Range/n
How to use ADX indicator for day trading?
The ADX indicator strategy is an essential technical skill for every trader interested in day trading.
When the ADX follows the positive index line, it indicates a bullish trend.
This is the time for bulls to go long – buy shares.
When the ADX follows the negative index line, it indicates a bearish trend.
This is when bears go short – sell their shares.
When the ADX isn’t clear, it doesn’t follow any specific trend but is up and down, which means there is no market trend.
The ideal ADX
When the value of ADX is above 25, it indicates a strong trend. This is when the traders must make decisions based on the market.
When the value of ADX is below 20, the market has no specific trend and isn’t very safe for traders to trade during this period.
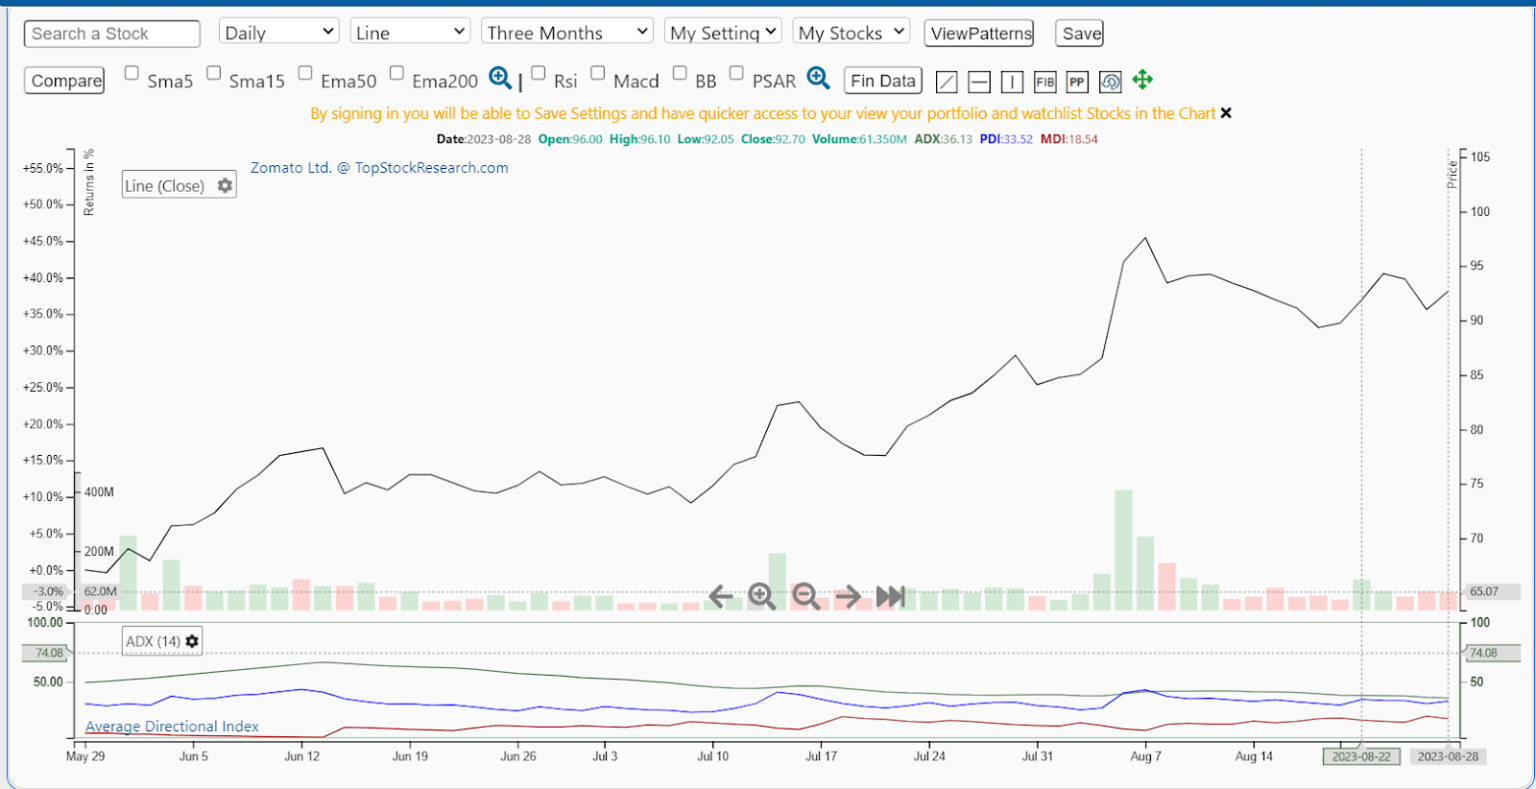
Case study
Below is the sample of the ADX chart and interpretation of Zomato as of 28 Aug 2023.
Bottomline
ADX is usually used along with other indicators like RSI (Relative Strength Index) for accurate results. ADX not only determines the strength of trends but also suggests the beginning of trend reversal patterns, which helps traders make decisions well in advance.
FAQs
The Relative Strength Index (RSI) and Average Directional Index (ADX) serve different analytical purposes. RSI is best for identifying potential reversals by indicating overbought or oversold conditions. ADX gauges the strength of a trend. For comprehensive analysis, traders often use both in tandem to capitalise on their unique signals.
The rule of the ADX indicator is to measure the strength of a trend. A reading above 25 typically indicates a strong trend, suitable for trend-following strategies, while a reading below 25 may signal a weaker trend, potentially useful for range-bound strategies. It’s important to note that ADX does not indicate trend direction.
The ADX indicator tells you about the strength of a prevailing trend. A higher ADX value suggests a stronger trend, which can be bullish or bearish. Traders use this information to assess the robustness of a trend and to make decisions about trade entries and exits.
Yes, ADX can be effective for intraday trading. It helps to identify strong trends within shorter time frames, which is essential for intraday strategies. Traders may adjust the period setting for greater sensitivity to price movements during the trading day.
ADX can be beneficial for scalping as it identifies strong trends, which are advantageous for quick, short-term trades. Scalpers may use a lower period setting for the ADX to react to rapid market movements, aiming to capture profits from small price changes.