Table of contents
Fluctuating stock prices can be confusing for investors. As optimism and pessimism about future earnings battle in the market, share prices swing wildly between highs and lows. How can smart investors make sense of these volatile price movements?
Chart patterns, like the “broadening top,” show a fight between buyers and sellers. Recognising this pattern can help investors understand changing market sentiment and potential trend reversals. With this tool, traders can make informed decisions and spot opportunities during volatility. In this article, we will understand how broadening tops can give investors an edge in uncertain times.
What is a

?
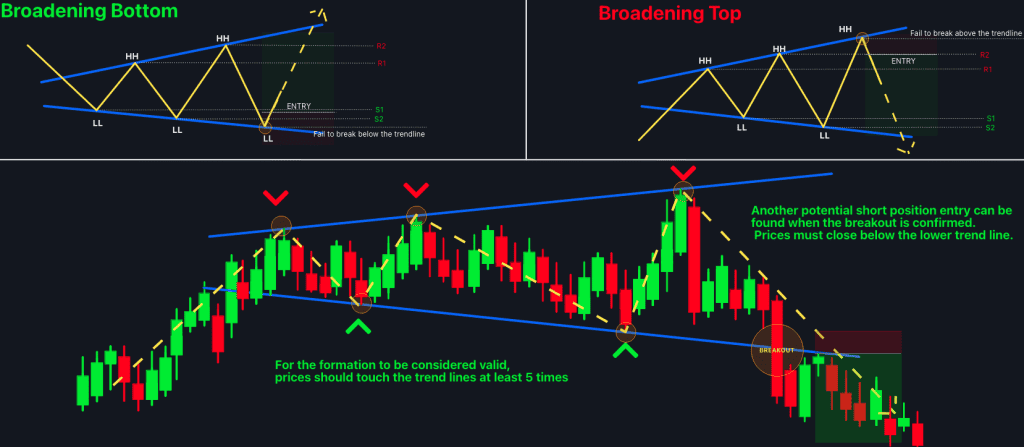
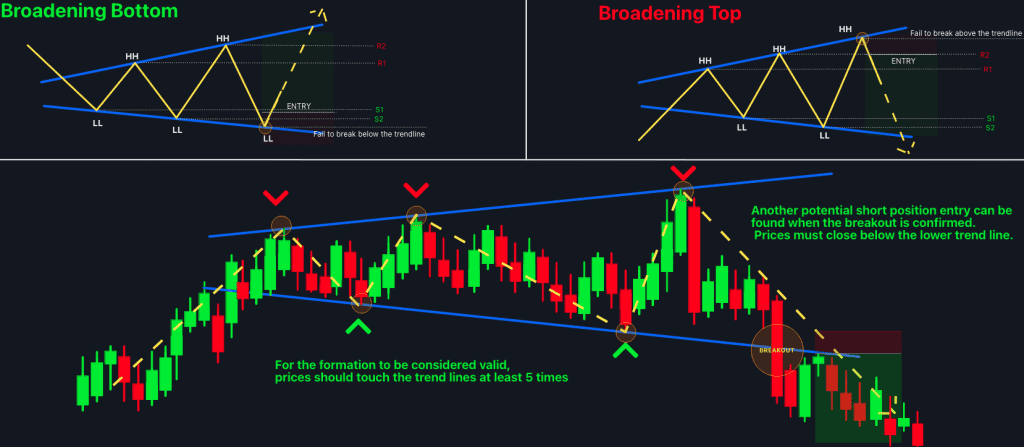
The broadening top has a distinct shape that reflects disagreement between optimistic buyers and sceptical sellers. It appears in uptrends as a series of higher and lower lows that progressively widen over time. This expanding pattern forms the shape of a megaphone or broadening wedge.
The displaced moving averages and widening gap between highs and lows reflect uncertainty about valuations. It’s as if bulls and bears are caught in a game of tug-of-war, pulling prices back and forth between extremes. This shows intensifying competition between different market participants’ diverging outlooks.

Signals a potential trend reversal
Unlike symmetrical triangles, which reflect consolidation, the broadening formation suggests rising volatility. Typically, the widening pattern leads to a trend reversal when optimism fades. The break below the lower low signals bears have overwhelmed bulls, kicking off a downtrend.
Thus, the distinctive broadening top pattern warns savvy chart readers that upside momentum is weakening. It puts traders on alert for an impending trend shift. The wide swings between highs and lows offer clues about investors‘ emotional state as optimism gives way to pessimism.
Key trading insights
1. Powerful signal for reversal trades
For swing traders and short-term contrarians, broadening tops offers useful insights. The distinct chart pattern telegraphs messages about shifting supply/demand dynamics. It highlights key inflexion points where bullish traders’ high expectations get dashed.
Thus, broadening tops presents opportunities for reversal trades. Traders can sell short as optimism evaporates after the pattern breaks support. Stops are placed on a close above the lower low. With confirmed breakdowns, the widening chart pattern propels decisive downtrends.
2. Captures investor indecision
Broadening tops reflect investors’ mixed views on valuations ahead of major fundamental shifts. Earnings reports, economic data, corporate actions, or new competitive threats often catalyse the volatile price action.
As investors grapple with uncertain outcomes around binary events, optimism and pessimism result in volatile tug-of-war price action. The broadening pattern captures this indecision in the market before a decisive breakout.
3. Trade the countertrend bounces
For very short-term traders, broadening tops also offer countertrend trading opportunities. During the pattern, optimism periodically resurfaces, driving sharp bounces off each lower low. Intraday traders can capture these bull traps.
Yet it’s critical to take quick profits on these countertrend bounces. Closing above the lower low would negate the pattern, so stops must be tight. The key is trading the short-lived fakeouts without getting married to a direction.
Identifying the signature broadening structure
Several visual cues distinguish broadening tops from other chart formations:
- Widening structure: A defining trait is a visually expanding pattern between at least two lower lows and two higher highs
- Volatility expansion: Successive price swings dramatically widen between peaks and troughs
- Upper shadows: Candles show long upper wicks reflecting bull traps
- Whipsaws: Frequent whipsaws between extremes reflect indecision
Emerging from uptrends
Context matters when identifying broadening tops. The hallmark megaphone structure only carries strong predictive power within ongoing uptrends.
Ideally look for the long white candles of prior rallies giving way to extreme volatility. The shift from clarity to chaos after a run-up telegraphs mounting risks ahead.
No clear duration
Broadening patterns emerge over weeks or months. Unlike triangles, which eventually resolve after the apex converges, broadening structures lack defined time limits. Heightened unpredictability can drag on indefinitely before the breakout.
This dynamic captures hyper-uncertainty in the market. Left open-ended, broadening tops reflect misleading back-and-forth price action fueled by competing investor expectations. Only the eventual breakdown or breakout ends the tense neutral zone.
Key rules and guidelines
Analysing the price action provides clues into shifting investor psychology:
- Long upper shadows: Bull traps hint that overly optimistic investors repeatedly get disappointed with each higher peak. Negative price reactions off the highs show ebbing momentum.
- Wide intraday ranges: Growing volatility and uncertainty are highlighted by the long upper and lower wicks stretching well beyond the bodies.
- Breakaway gaps between highs/lows: Emotional impulses drive prices to gap way from previous limits between extremes. These sharp breaks reflect short-lived fear/greed.
- Stretched moving averages: The expanding pattern leaves moving averages stranded well below the highs and above the lows. Their forecasting power diminishes.
Volume climax signals exhaustion
A volume climactic signals broadening tops end soon. Watch for a sharp volume spike as prices hit new extremes. This intense activity marks exhaustion. The following decline indicates supply is overwhelming demand.
- Don’t anticipate breakouts
It’s tempting to guess which way prices will break out. Yet broadening patterns offer mixed signals until the actual break. Prematurely jumping the gun leads to trouble. Stay patient and wait for confirmation before trading breakouts.
- Set stops below lower lows
Once a breakdown is confirmed, protective sell stops belong below the pattern’s lowest swing point. This defining technical level must hold to maintain the bearish bias. Any rise back above it would trigger stops.
Managing trades triggered by broadening tops
New downtrends start once prices close below the lower low of the broadening formation. This breakdown can trigger short entries.
Initial downside targets project to the lowest point of the previous uptrend. For greater reward/risk, trail protective stops below shorter-term swing lows.
Book partial profits into sizable sell-offs are approaching prior support levels. Move stops to break even on the rest of the position to lock in potential gains.
Countertrend trading rules
The widening swings between highs and lows also allow countertrend trading tactics. Here are some tips:
- Fade temporary bounces off the lows – Capture bull traps but use tight stops.
- Take quick profits near the mid-point – The extremes tend to overshoot, so don’t get greedy.
- Wait for confirmation of another leg down before re-shorting – Let the pattern resume before repeatedly trading the same zone.
- Avoid holding through earnings reports or major news events – Fundamental surprises will turbocharge volatility.
Conclusion
Broadening top patterns show uncertainty in financial markets, and understanding them can help traders make better decisions. Keep an eye out for these patterns to be better prepared for formation shifts in the market.
FAQs
A broadening top is a reversal chart pattern that forms during an uptrend when prices start making wider swings with both higher highs and lower lows, reflecting disagreement between increasingly polarised bulls and bears. This back-and-forth price action looks like an expanding megaphone or broadening triangle on the chart.
Key tips-offs are expanding volatility, with prices visibly making wider swings between peaks and troughs over time. You’ll also see prices registering successive higher highs followed by lower lows at increasingly extreme levels. Volume should pick up on the price swings as conviction builds behind the pattern.
Stock market volatility can be caused by uncertainty before earnings or data releases, over-optimism, hitting resistance levels, or a tired market.
Classic strategies are entering short positions as prices break down out of the lower border, using indicators like bearish RSI divergences to confirm, buying put option spreads anticipating the downside and employing protective stop losses on existing longs to lock in open profits.
Actually, no. Broadening tops are relatively rare compared to more common consolidation patterns. But when they do occur, savvy traders take notice as they reliably warn of trend reversals ahead. Their uncommon nature makes broadening tops a high conviction signal.