Candlestick charts are some of the most commonly used tools under technical analysis. The candlesticks are unique, as they use four different price points – High, Low, Open and Close, to show stock market trends, as a result of which they are widely in use. Explore the fascinating world of candlestick chart patterns. Discover the significance, types, and trading techniques of these visual stock market indicators, and embark on a journey to master the art of stock trading.
A doji candlestick is where the opening and closing prices are very close, suggesting a trend where both bulls and bears try to dominate the market, but neither of them succeeds.
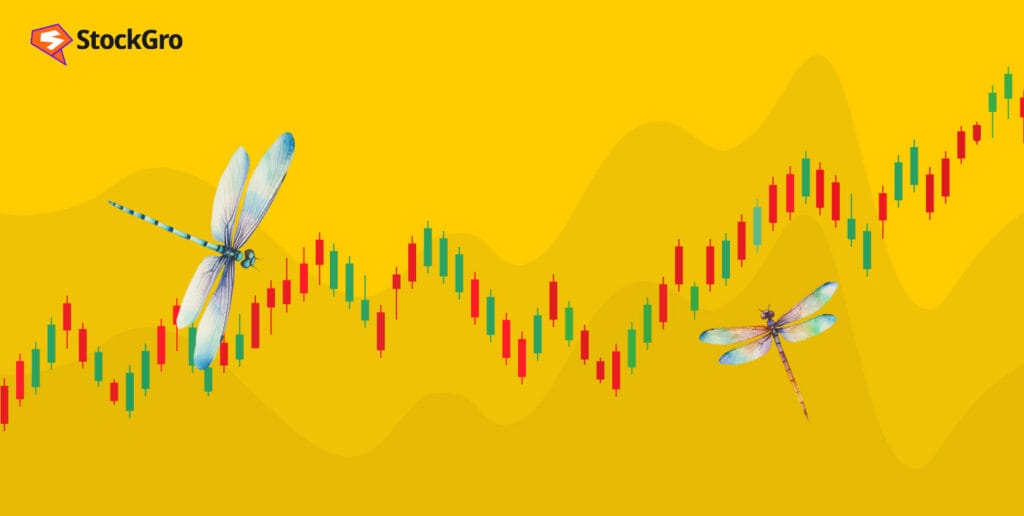
What is dragonfly doji candlestick?
A dragonfly doji candlestick is one of the four candlestick patterns, indicating a possible price reversal trend. It forms when the opening, closing and the high price points are almost the same, while the low price point is very far from the three. Reversal candlestick patterns are patterns that identify reversals in the market sentiment. This could be in either direction, bullish or bearish.
This candlestick suggests that there may be a price reversal after an uptrend or downtrend in the market. So, if the earlier price action has been in an uptrend, a dragonfly doji candlestick hints at a price fall and vice versa.
A single dragonfly doji candlestick is not enough to confirm any trend or reversal. The traders must wait for the next candle to see if prices are moving as expected and then take necessary positions.
You may also like: Bullish engulfing candlestick pattern: Learn how to spot trend reversals
How do you identify a dragonfly doji pattern?
This candlestick gets its name from the shape it takes – it looks like a dragonfly.
The wick on top is almost invisible, as the high price point is more or less the same as the open and close price points.
The lower wick is long, indicating the low price point is far from the others.

Deciphering the dragonfly candle
When the market has been in an uptrend, i.e., prices are increasing until a point of resistance, a dragonfly doji candlestick forms at the top of the chart. It indicates that the prices may fall from that point.
Similarly, in a downtrend market where prices fall until they reach a point of support, dragonfly doji candlestick forms at the bottom of the chart, suggesting an increase in price going forward.
The long lower wick shows a strong pull from the bearish traders in the market, trying to bring the prices down. But, a strong force from the bulls takes the prices upward to the maximum point possible, and the stock is finally closed there.
Since bulls and bears are equally powerful here, the market is not influenced by either of them. Empower your trading with insights on bull and bear flag patterns. Decode market signals and make informed decisions today!
Is dragonfly doji bullish?
Yes, the dragonfly doji candlestick indicates a bullish pattern before the formation of the doji candle. Since this is a reversal trend indicator, the market becomes bearish after the formation of this doji candle.
Trading based on the dragonfly doji
Traders usually wait for the next candle after the dragonfly doji candlestick to confirm the reversal trend. If the next candle formed does not satisfy the reversal criteria, traders pause their actions. It indicates that the market continues to be indecisive, and the dragonfly doji is a false alarm.
If traders can confirm the reversal pattern in the next candle, this maybe the right time to trade. The confirmation candle is an indication that traders can go long, i.e., buy shares.
Traders who do not want to take risks, wait for the price to go higher than the candle before the doji. The lowest point of the doji candle is considered the stop loss point.
Also Read: Deciphering the rising wedge pattern in stock trading
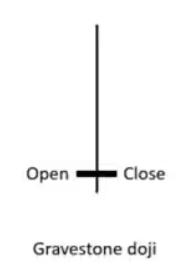
Dragonfly doji vs. Gravestone doji
Similar to the dragonfly, gravestone is another type of candlestick indicating a reversal trend. While the dragonfly indicates a bullish reversal, the gravestone suggests a bearish reversal.
The opening, closing and low price points in a gravestone candlestick are almost the same, while the high price is considerably far from the other three.
In order to identify dragonfly or gravestone candles, one must not look at where these candles form. Instead, the shape of the doji candlestick and the longer wick indicate whether it is a bullish or bearish reversal.
Dragonfly Doji vs Hammer Candlestick Pattern
A Dragonfly Doji candlestick and a Hammer are both significant in technical analysis as they show signs of a reversal in the market with nuances on structure and interpretation.
A Dragonfly Doji candlestick occurs when the opening, closing, and high prices are nearly the same, but the low price is much lower, forming what is known as a long shadow. This pattern suggests a balance between buyers and sellers. Initially, the price drops significantly, but the buyers push it back up, closing near or at the opening price. The long lower shadow reflects selling pressure that was absorbed by buyers, making it a strong bullish reversal signal, especially in a downtrend. However, it is crucial to confirm this signal with subsequent candlesticks or volume increases to avoid false breakouts.
The Hammer pattern also appears after a downtrend and is characterized by a small body at the upper end of the trading range with a long lower wick, indicating that sellers drove the price down but buyers regained control, closing the price higher. Unlike the Dragonfly Doji candlestick, the Hammer has a small body rather than no body, but it similarly signals a bullish reversal. The longer the lower shadow, the stronger the bullish signal.
At the end, both patterns are bullish reversal signals after a downtrend, but the Dragonfly Doji candlestickhas no real body, while the Hammer features a small body. Confirmation with further price action or volume is key to making trading decisions based on these patterns.
Limitations of dragonfly doji
Though price reversal is a common trend in the stock market, the formation of dragonfly doji is quite rare.
This is because, it is not often that the high, open and close price points are all the same.
The confirmation candle required after the dragonfly doji candle is also a rare formation. It does not always occur after a doji candle, which makes decisions difficult for traders.
Hence, the dragonfly doji, though powerful, is not a very reliable indicator in suggesting market patterns to traders. Learn to identify and interpret share market chart patterns and how technical chart patterns can signal profitable trading opportunities.
Case study
Below is a sample dragonfly doji candlestick chart of HDFC as of Feb 2022.
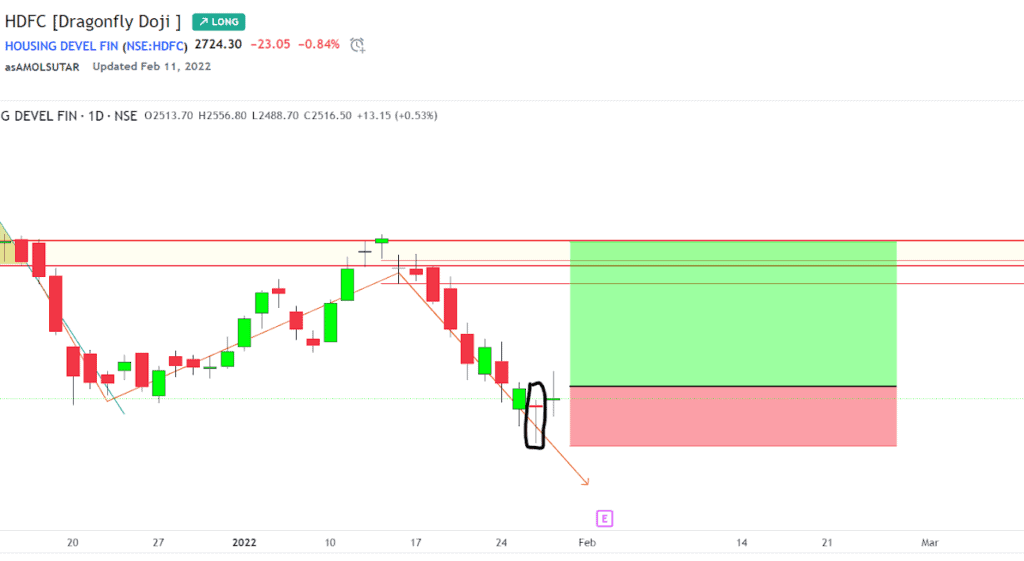
The candle highlighted in black is the dragonfly doji candle.
It can be noticed here that the market was in a downtrend before the formation of dragonfly doji.
Upon the formation of the dragonfly doji, the prices are rising as expected. It indicates the reversal pattern of a downtrend market.
The candle after the doji candlestick confirms the reversal in trend.
Also Read: Between bulls and bears: The power of the flag pattern in trading
Bottomline
In conclusion, candlestick charts are one of the most commonly used indicators in technical analysis. Dragonfly dojis, as discussed, are a rarity. Hence, it requires immense practice and understanding of this concept in order to make decisions on this basis.
However, dragonfly doji used with other technical indicators may help predict accurate results. Additionally, it is essential to wait for the confirmation candle before taking any position based on the dragonfly doji.