Of the various charts used for technical analysis of stocks, candlesticks are distinctive for including all four price points essential in decision making.
When the opening and closing prices are not far from each other, the market is indecisive, where both the bulls and bears are not in domination.
To mitigate the risk of trading during such uncertainties, the doji and its reversal patterns are beneficial.
What is the gravestone doji candlestick?
The gravestone is one such doji candlestick pattern, representing a potential reversal in market trends. In an uptrend market, the formation of gravestone doji hints that the market may have a downtrend now, and vice-versa.
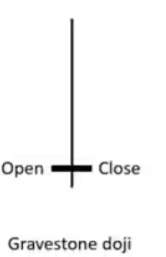
A gravestone doji is where the opening, closing and low prices are nearly the same, and the highest price is far from the three.
What does a Gravestone Doji indicate?
A Gravestone Doji is a type of candlestick pattern that shows up in financial charts and often signals possible market changes. It happens when the opening and closing prices are almost the same, with a long upper shadow and very little or no lower shadow. This shape looks like a gravestone, which is why it has that name.
The Gravestone Doji shows that during the trading period, buyers raised prices a lot, but sellers stepped in and lowered the price back down to where it started by the end of the period. This could indicate a decreasing buying interest and a bearish reversal may be imminent.
Traders often look for this pattern at the end of an upward trend, particularly when it forms at a resistance level. However, to confirm the reversal, it is advisable to consider subsequent price action and volume. A strong bearish candle following the Gravestone Doji can reinforce the signal, indicating that the market sentiment may have shifted from bullish to bearish.
How to Spot the Gravestone Doji Candlestick Pattern?
The body of the gravestone doji is only a thin line since the opening and closing prices are almost equal. The lower wick of the candle is nearly invisible since the lowest price is more or less the same, too.
However, the upper wick is long, indicating that the highest price point is far from the three. The position of the gravestone doji depends on the previous market trend.
In an uptrend market, the gravestone doji candle is at the top of the chart, and the doji is at the bottom in a downtrend market.
You may also like: What does the Doji candle tell us about the market?
Explicate the gravestone doji candle
In an indecisive market, bulls and bears exert equal pressure.
In the gravestone doji situation, bulls try to take the prices up. Bears, being equally powerful, pull it down. Towards the end, bears take the lead and close it at a level equal to the opening price.
In an uptrend market, where prices increase up to the point of resistance, the bears bring prices down. The gravestone doji here is formed at the top of the chart.
The gravestone doji is rarely formed at the bottom of the chart, meaning it is usually not found in a downtrend market.
Is the gravestone doji bearish?
The gravestone doji is always a bearish indicator. It suggests that the bears are in power, and the prices are expected to fall after they have been in an uptrend for a while.
In a rare scenario, if the gravestone doji is formed at the bottom of the chart (in a downtrend), there may be a possibility of prices falling further.
Trade the gravestone doji candlestick
Understanding how to decide entry, exit, target price and stop loss points is essential for any trader to maximise profits and minimise losses.
The highest point of the upper wick should be set as the stop loss point in a gravestone doji. Traders who take short positions should wait for the next few candles to appear. Once a candle goes down and closes below the body of the gravestone doji, traders can open their short positions and start selling.
The target price usually depends on the length of the gravestone doji’s upper wick.
It is suggested that the traders wait for the next candle after gravestone doji to appear to confirm pattern reversals. Since the gravestone doji usually appears in an uptrend, the following candle is expected to start going downward, marking the beginning of a downtrend.
If the candle following the doji isn’t in the expected reversal pattern, the gravestone doji might be a false alarm.
What’s the opposite of a Gravestone Doji?
The opposite of a gravestone doji is known as a dragonfly doji. Both candlestick patterns signify market indecision, but they reflect different market sentiments.
A gravestone doji occurs at the top of an uptrend and indicates a potential reversal to the downside. It has a long upper shadow, a small real body at the bottom, and little to no lower shadow, suggesting that buyers pushed the price higher but ultimately failed to maintain that momentum.
On the flip side, a dragonfly doji appears at the bottom of a downtrend and signals a potential bullish reversal.
This pattern features a long lower shadow, a small real body at the top, and little to no upper shadow, indicating that sellers drove the price down initially but could not sustain control.
As a result, buyers entered the market and pushed the price back up to near the opening level. Traders often look for confirmation through subsequent bullish candlesticks after a dragonfly doji, as it may indicate a shift in market sentiment from bearish to bullish.
Also Read: Understand dragonfly Doji and its indication of stock market trends.
The resemblance between gravestone and dragonfly doji
Both the dragonfly and gravestone doji are candlesticks with very thin bodies, one long and one nearly invisible wick.
They represent similar situations of pattern reversals following a particular trend.
Both the candlesticks appear in a situation of market indecision, trying to hint that the bulls or bears may take over, depending on the previous trend.
While the dragonfly indicates a bullish reversal trend, the gravestone doji suggests a bearish reversal trend.
When either of them appears, the following candle acts as proof to confirm reversal trends.

Limitations of the Gravestone Doji Pattern
The gravestone doji candlestick pattern, which is generally considered a sign of trend reversal, does not hold good when the doji rarely appears at the bottom of the chart.
Even when the doji appears on the top, it is unreliable unless the reversal is confirmed.
It is sometimes possible that the traders identify the wrong candlesticks as gravestone doji – this happens when the body is small and the lower shadow is very short.
Although it may appear like a gravestone doji, it may not be when observed closely.
Case study
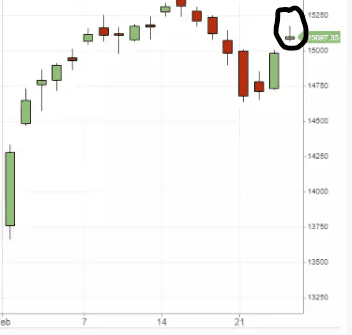
Below is a sample gravestone doji candlestick.
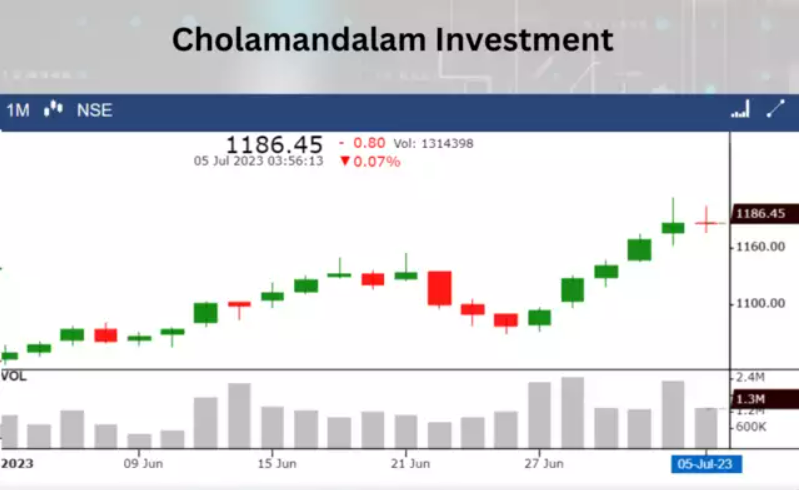
A recent candlestick pattern chart of Cholamandalam Investments shows the formation of a gravestone doji on 5 July 2023.
The market has been in a bullish market/uptrend, before the formation of gravestone doji.
This doji indicates that the prices of Cholamandalam may drop, turning the market bearish.
Bottomline
Though a very commonly used method of technical analysis, candlesticks such as the gravestone doji have limitations.
Also Read: Bullish engulfing candlestick pattern: Learn how to spot trend reversals
Since this is not a fool-proof technique, using this approach with other technical tools, like the moving averages and trend lines, is always better for better results.
Nevertheless, this inverted ‘T’ candlestick is considered an essential sign of warning that assists traders in being prepared for future price movements in the market.