Table of contents
- Hammer Candlestick Pattern: Definition, Meaning & Key Features
- What is a Hammer Candlestick pattern?
- How to Interpret the Hammer Candlestick Pattern in Trading
- Inverted Hammer Candlestick: Key Differences & Trading Strategy
- Bullish vs. Bearish Hammer Candlestick: Key Differences
- Red & Green Hammer Candlestick: What Do They Indicate?
- The closing
- FAQs
Among the myriad trading tools on the market, few are as powerful as the Hammer Candlestick. Hammer patterns, signalling potential trend reversals with striking visuals, can shape the course of trading fortunes.
Let us help you discover the Hammer Candlestick Patterns and understand why it is a powerful tool for traders to shape their trading strategy.
Hammer Candlestick Pattern: Definition, Meaning & Key Features
In financial markets, candlestick patterns are graphical illustrations that represent price movements. While using this tool, the length of the candlestick’s wick is in focus, which indicates the price movement and potential market sentiment.
A pattern can be formed with a series of candlesticks representing open, high, low, and close asset prices during a period.
You may also like: Essential guide to candlestick patterns for beginners
What is a Hammer Candlestick pattern?
There can be varied candlestick patterns in terms of formation, each with its own interpretation for price direction. A recognised candlestick pattern is the hammer. The pattern’s name – hammer – is based on its shape’s resemblance to a hammer.
It suggests a downward price swing that has encountered significant buying pressure, resulting in a potential shift in market sentiment and the likelihood of a bullish reversal.
Price action traders can identify reliable price reversal points by observing hammer chart patterns. Hammer patterns usually appear after a period of bearish trend or at the end of a correction.
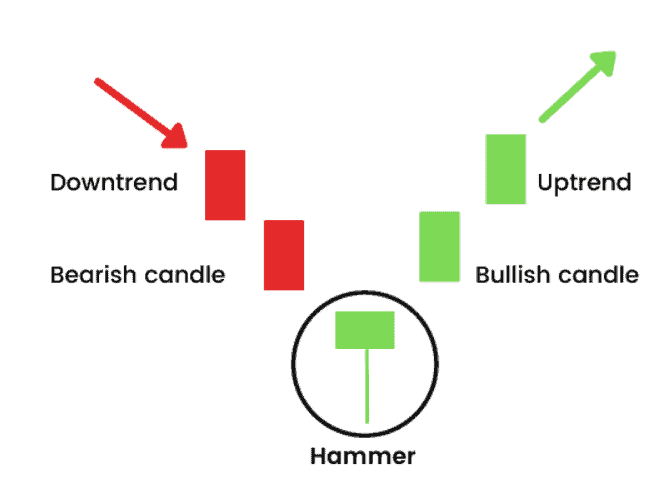
It is characterised by its distinct appearance, consisting of the following main components:
- Position: A hammer pattern forms near the bottom of a trend.
- Shape: This single candlestick pattern has a small body and a long lower shadow (i.e. shadow extends downward from the body), at least twice that of its body. Generally, the upper shadow does not exist. If present, it usually tends to be of minimal length.
- Colour: Hammer’s body can be green (bullish) or red (bearish).
How to Interpret the Hammer Candlestick Pattern in Trading
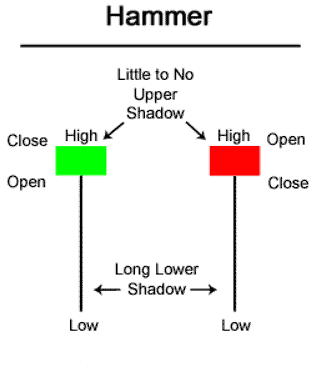
Characterised by its short green or red candle and long wicks, hammer patterns signify a rejection of lower market prices.
- Green hammer refers to a higher closing price of the candle than the opening price. On the other hand, a red hammer indicates a higher opening price of the candle than the closing price.
However, the body colour does not matter much because whether the colour is red or green, the hammer pattern often indicates a bullish price reversal. - A lower wick represents a low price during the session. Therefore, a long lower wick in this bullish reversal pattern suggests prices moved significantly lower during a specific trading period.
The pattern suggests a trend reversal where buying pressure ultimately controlled the final price action.
Confirmation and follow up to validate the signal’s reliability
When considering a hammer pattern in isolation, there is no certainty of a price reversal, and it does not help traders determine the price target.
Therefore, they look for other technical indicators, like divergence on an oscillator, or candlestick patterns, like bullish engulfing patterns, etc., that can support the trend reversal signal identified by the hammer pattern.
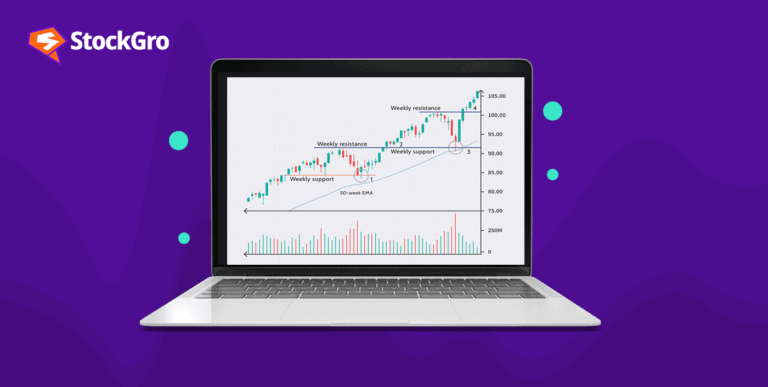
Hammer Candlestick Pattern Example & Market Applications
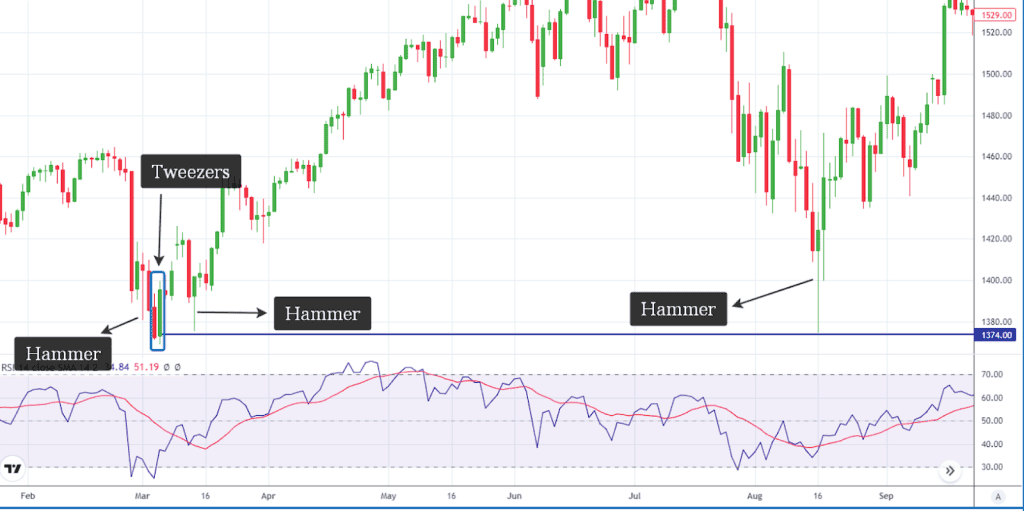
Source: TradingView
The above chart had a hammer pattern because it began after a correction. This red hammer, formed on 16th March, was the first candle that indicated trend reversal or uptrend.
Another hammer emerged from the top. This candlestick is a hammer because it is still at the bottom of a trend.
On 16th August, a powerful hammer appeared. It was a good indicator because it was green with an elongated lower wick.
The second and third hammers brought trading opportunities as the first two hammers, and the tweezers were the confirmers of the third hammers. Also, it formed after a significantly long downtrend.
Inverted Hammer Candlestick: Key Differences & Trading Strategy
The Inverted Hammer in the stock market also serves as a bullish reversal pattern, but a long upper wick distinguishes it. It forms when the opening price is less than the closing price. During a downtrend, an inverted hammer indicates that there is buying pressure.
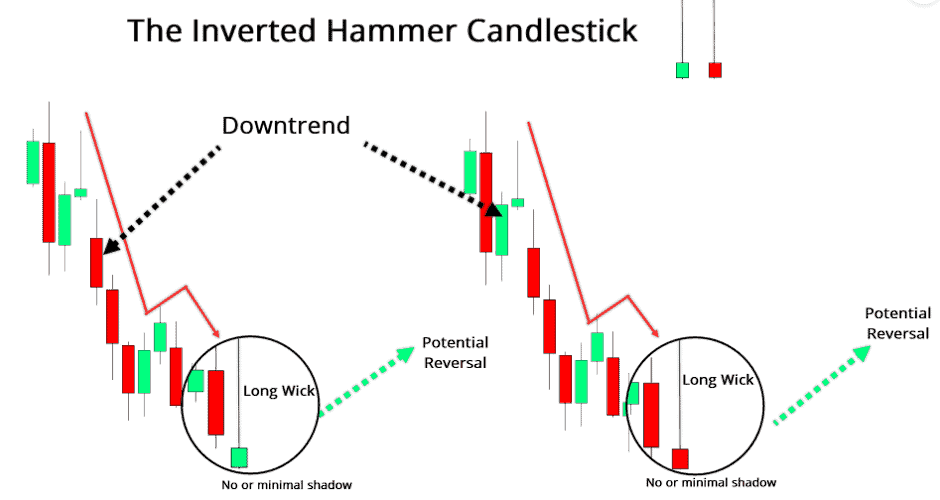
It is less reliable as it is not as bullish as the ordinary hammer candlestick.
Bullish vs. Bearish Hammer Candlestick: Key Differences
| Type | Appearance | Market Implication |
|---|---|---|
| Bullish Hammer | Forms after a downtrend with a small green body and long lower wick. | Signals a potential reversal to an uptrend. |
| Bearish Hammer (Hanging Man) | Appears after an uptrend with a small red body and long lower wick. | Suggests a possible reversal to a downtrend. |
Key Differences
- Bullish Hammer appears in a downtrend and signals a reversal to an uptrend.
- Bearish Hammer (Hanging Man) appears in an uptrend and signals a potential reversal to a downtrend.
- Both indicate that buyers attempted a recovery after a price drop, but the market response determines the next move.
Red & Green Hammer Candlestick: What Do They Indicate?
Green Hammer (Bullish Hammer)
- Formation: A green (bullish) hammer forms when the closing price is higher than the opening price.
- Meaning: Indicates strong buyer pressure as the price recovers significantly from its low.
- Trader’s Action: Often considered a buying opportunity if confirmed with volume and the next candle closing higher.
Example:
- Stock drops from ₹500 to ₹450 but closes at ₹490, forming a green hammer.
- If the next candle is bullish, traders may expect an uptrend continuation.
Red Hammer (Bearish Hammer or Hanging Man)
- Formation: A red (bearish) hammer forms when the closing price is lower than the opening price.
- Meaning: Signals that buyers attempted to push prices up but sellers regained control before the close.
- Trader’s Action: A cautious approach is needed—confirmation is required before trading.
Example:
If the next candle is bearish, it may indicate a trend reversal downward.
Hammer Pattern in Uptrend & Downtrend: What Traders Should Know
Hammer in a Downtrend (Bullish Signal)
- Appears at the bottom of a downtrend.
- Suggests buyers stepped in after heavy selling.
- Confirmation: Needs a bullish candle after the hammer to validate the reversal.
- Best used with RSI, MACD, or volume analysis to confirm a trend shift.
Hammer in an Uptrend (Bearish Hanging Man Signal)
- Appears at the top of an uptrend.
- Suggests buyers tried to push prices higher, but sellers took control.
- Confirmation: Needs a bearish candle after the hammer to confirm the reversal.
- Traders often wait for further signals before shorting the stock.
Practical Trading Tips
Support & Resistance Analysis: Works best near key support or resistance levels.
The closing
Volume Confirmation: A hammer with high volume is more reliable.
Next Candle Validation: A strong follow-up candle confirms the trend direction.
A stock rises to ₹600, drops to ₹550, and closes at ₹560, forming a red hammer.
The hammer candlestick pattern stands as a prominent tool for technical analysis associated with trend reversal. Skilled traders can leverage the hammer candle patterns with other trading patterns to navigate the complexities of the financial markets and trade cautiously.
FAQs
A Hammer pattern indication is likely to have a success probability of around fifty percent. However, positions that are based on winning signals tend to stay open for a considerable amount of time, while losing signals are often closed in a very short amount of time.
A hammer candlestick is a buy signal that suggests a bullish reversal. However, it needs confirmation. The next candle must close higher than the hammer’s closing price. This indicates strong buying pressure.
At the bottom of a downtrend, a bullish reversal is represented by a hammer candlestick pattern. Hammers suggests a possible reversal to an uptrend by signalling that the bears are no longer in control of the markets. If the candle following the hammer closes above its closing price, confirmation follows.
Among the most advantageous candlestick patterns are the ascending triangle and the bullish engulfing patterns. Similar to other types of technical analysis, it’s essential to keep in mind that there are no guarantees and to search for bullish confirmation.
This triple candlestick pattern suggests the beginning of a new uptrend and the potential ending of the previous one. The first candle, which has a lengthy bearish candlestick, should be located near the bottom of a downtrend. These characteristics indicate a three-inside-up candlestick formation.