Table of contents
The MACD is one of the most popular technical indicators in stock trading.
In the trading world, the Moving Average Convergence Divergence (MACD) indicator is a powerful tool. Known for its versatility, the MACD is popular among both beginners and seasoned traders.
Unlike many other technical indicators, the MACD enables you to identify potential entry and exit points, gauge market momentum, and even spot potential reversals.
This article explores the MACD indicator strategy, offering insights for effective use. Whether you’re an experienced trader or a beginner, understanding the MACD can enhance your trading decisions.
What is the MACD indicator?
The full form of the MACD indicator is Moving Average Convergence Divergence. It is a momentum and trend-following indicator developed by Gerald Appel in the 1970s. It remains a trusted momentum filter in trading.
The MACD indicator formula is simple. It measures the difference between a stock’s 26-day and 12-day exponential moving averages (EMA), using the closing prices of the measured period.
Components of the MACD indicator
Primarily, this indicator consists of three main, individual components.
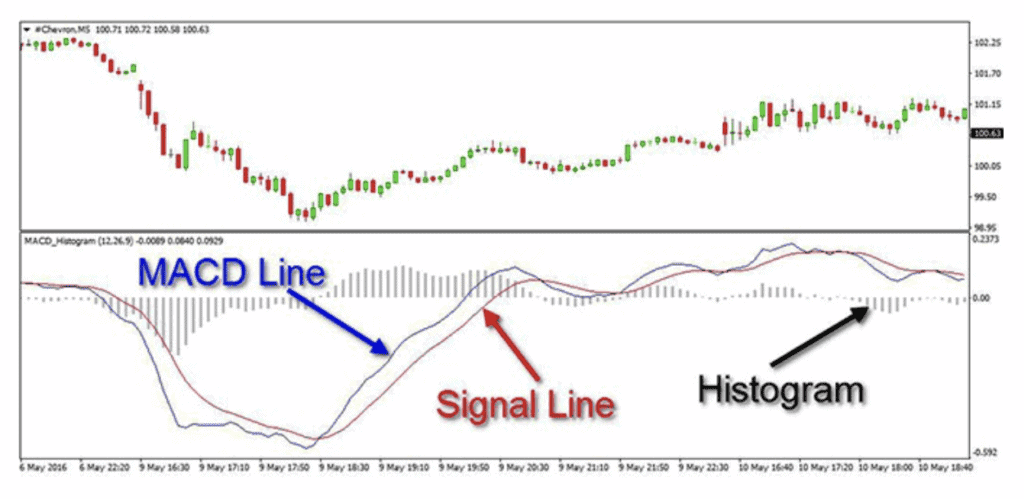
- The MACD line – The MACD Line is a faster-moving line and represents the difference (or distance) between two moving averages (usually a 12-period EMA and a 26-period EMA).
- The signal line – The signal line is the second crucial component of the MACD indicator. It indicates the 9-period EMA (default setting) of the MACD Line.
- The MACD histogram – The histogram is the difference between the MACD line and the Signal line.

How to read MACD indicator?
There are several ways to read the MACD depending on what you’re looking to get out of it. Here are some ways.
Crossovers
Crossovers are key to understanding what is MACD in the stock market. They signal potential market momentum shifts and offer buy or sell signals. There are various types.
A bullish crossover happens when the MACD line surpasses the signal line, suggesting a possible shift from a bearish to a bullish trend, or a strengthening of an existing bullish trend.
Similarly, a bearish crossover happens when the MACD line falls below the signal line. This is often seen as a sell signal, indicating a good time to sell or short.
While crossovers are useful signals, they should be used with other technical indicators and not taken at face value.
Histogram
The MACD histogram has vertical bars above or below a zero line. Bars above the line indicate the MACD line is over the signal line, a bullish sign.
When bars are below the zero line, it indicates bearish momentum. The bar length shows the strength of the difference between the MACD and signal lines.
There are several ways in which you can interpret the histogram:
- When histogram bars are above the zero line and growing, it’s a bullish signal, indicating a good time to buy. If they’re above the line but shrinking, it suggests weakening bullish momentum.
- Expanding bars below the zero line indicate growing bearish momentum. The converse applies too.
MACD with the RSI and SMA
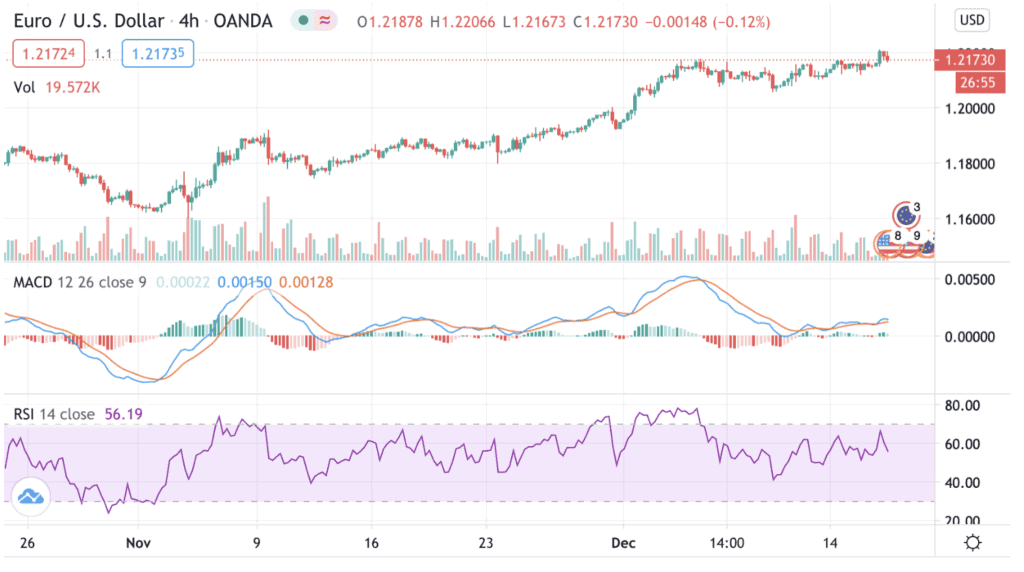
It is also a popular practice to use the MACD in conjunction with the Relative Strength Index (RSI) and the Simple Moving Average (SMA). This is how to use MACD indicator:

The RSI is an indicator that gauges the strength of a trend and identifies reversal points. It uses a 14-period baseline with overbought and oversold levels typically at 80 and 20.
Simultaneously, the SMA computes the average price fluctuation over a specified period on the candlestick chart, helping predict if the current trend will persist or reverse.
A combination of these three indicators helps traders:
- Determine future price changes using the RSI
- Show how strong a trend is and where it’s headed using the MACD
- Use the SMA as a lagging trend-following indicator
Limitations of the MACD
A common problem with the MACD indicator is that it can falsely signal an impending price reversal that doesn’t occur. This can be deceptive. Another issue is that it often forecasts numerous false reversals and overlooks actual price reversals.
To ensure accuracy, you can pair the MACD with the Average Directional Index (ADX). The ADX acts as a trend indicator. If it’s above 25, a trend is present. If it’s below 20, the trend is unclear.
If the MACD indicator in the share market has a bearish divergence, cross-check with the ADX. If the ADX shows a strong upward trend, consider delaying a bearish trade based on the MACD alone. This approach helps avoid rash decisions and allows time to observe market trends.
Conclusion
In conclusion, despite the reverence of the MACD in the technical analysis world, you can see that it is best used with another indicator – whether that’s the RSI, the SMA, or even the ADX. Cross-referencing is the name of the game in technical analysis because it lets you increase your conviction in a trade.
FAQs
A good MACD value is typically seen as positive, indicating increasing upward momentum when the short-term average is above the longer-term average. The standard settings for MACD are 12 for the short-term moving average, 26 for the long-term moving average, and 9 for the signal line. However, these values can be adjusted based on trading style and goals. Always use MACD in conjunction with other indicators for best results.
Yes, the Moving Average Convergence Divergence (MACD) is a popular tool among day traders. It helps pinpoint market momentum and identify potential entry and exit points. However, it’s important to note that while MACD is widely used, it can sometimes give false signals. Therefore, traders often use it in conjunction with other indicators like the Average Directional Index (ADX) for more accurate trading decisions.
The Relative Strength Index (RSI) is a momentum indicator that measures the speed and change of price movements. It oscillates between 0 and 10012. Traditionally, an RSI above 70 indicates overbought conditions, while below 30 signals oversold conditions. It helps identify potential entry and exit points. However, it’s best used in conjunction with other indicators to avoid false signals.
To avoid false signals from the Moving Average Convergence Divergence (MACD) indicator, traders should adopt a comprehensive approach to market analysis. This involves using other technical indicators in conjunction with the MACD to confirm its signals. For example, traders could use the Relative Strength Index (RSI) or Bollinger Bands to verify the MACD’s signals. Additionally, increasing Exponential Moving Average (EMA) periods in slow-moving markets can help reduce false signals.
The Volume Weighted Average Price (VWAP) and Moving Average Convergence Divergence (MACD) can be used together for effective trading. VWAP provides a benchmark of the average price a stock has traded at, weighted by volume. MACD, on the other hand, identifies potential buy and sell signals. When the MACD line crosses above the signal line (bullish crossover), it’s a potential buy signal. Conversely, when it crosses below (bearish crossover), it’s a potential sell signal.