Table of contents
Technical analysis is one of the most significant techniques for stock market traders. Despite the risks and fluctuations in the stock market, using the appropriate technical analysis tool can help traders analyse the market and predict the future, which is essential while making decisions.
One such tool that helps in predicting the potential direction of stock prices is the hockey stick chart pattern. In today’s article, let us understand what this pattern means and indicates.
What is the hockey stick chart pattern?
The hockey stick chart is a line graph where different data points are plotted and joined to form a line that looks like a hockey stick. Usually, this chart helps analyse the performance of companies, based on which traders predict how the stock prices may move.
The hockey stick chart applies to various fields, such as economics, politics, medicine, etc. Generally, the chart is formed in any scenario where the data shows a significant shift.
How to read the hockey stick pattern chart?
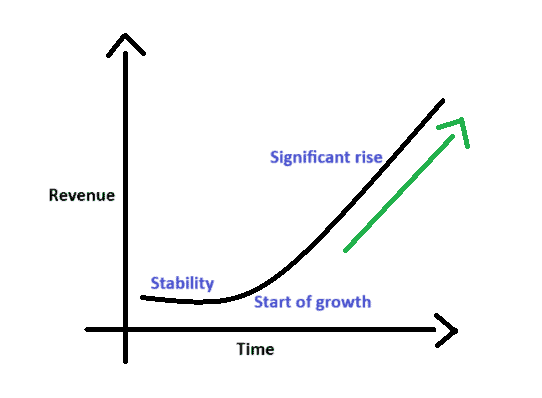
The hockey stick pattern shows three stages:
- The first stage indicates a flat and stable scenario
- The second stage is where there is a curve, indicating the beginning of a change
- The third stage shows a sharp rise, suggesting a significant change in the trend
The hockey stick pattern is widely used by traders in the stock market to analyse the performance of companies. They use the chart to observe various figures, such as revenue, profit margins, etc., to understand how the company’s stocks might be affected.
Suppose a trader spots a hockey stick pattern while analysing Company ABC’s sales figures on a line graph. This is how the trader interprets the chart:
- The horizontal line, commonly called the blade, suggests the period where sales are stable. There is no significant movement either upward or downward.
- The slight curve at the blade’s heel suggests a slow rise in sales.
- The rising diagonal line or the shaft suggests a sharp increase in sales.
Such trends in the company’s performance are often followed by its stock prices rising. Traders use these patterns to predict the stock’s future and take positions accordingly. It is particularly helpful for bullish traders looking for signals to go long on a stock.
Besides using this pattern in other related aspects, the hockey stick pattern can be observed on stock price charts, too. When the stock price is stable for a while and then significantly rises, it forms a hockey stick pattern. It indicates the dominance of bullish traders after a steady period.
Benefits of the hockey stick pattern
- The hockey stick pattern is visually clear. The pattern is easily identifiable and helps traders make trading decisions.
- Forecasting potential trends in stock prices using a hockey stick pattern is easy. It helps traders identify undervalued stocks and invest in them to earn profits when such stocks grow.
- Besides traders, the hockey stick pattern helps other stakeholders, like a company’s management. It significantly aids in forming strategies and future goals.
Limitations of the hockey stick pattern
- Every stability and rise does not indicate a hockey stick pattern. Sometimes, it may only be a temporary rise or a false indication. In such cases, the pattern may mislead traders to make inaccurate decisions.
- The hockey stick pattern in business may signify a potential uptrend in its stock prices. But, there is an uncertainty about when the uptrend may begin, which may cause delayed decisions.
- The formation of a hockey stick largely relies on the data used. Incorrect or incomplete data will cause a wrong understanding of the situation, which will in turn lead to incorrect decisions.
Bottomline
The hockey stick pattern is a technical tool that suggests an uptrend after a period of stability. It has various uses, including applications in the stock market, economics, company management, medical science, etc.
Stock market traders use the hockey stick pattern to analyse a company’s performance and then predict the stock’s price movements on that basis. While the hockey stick is undoubtedly an effective pattern, it has some limitations, too. Hence, it is suggested to use it with other trend-confirming patterns before making investment decisions.
FAQs
The hockey stick pattern in a stock price chart indicates how the stock prices are moving. It shows that the stock price has been stable for a while, after which it significantly rises. It is an indication of the market being sideways, after which bullish traders take control.
Often, the hockey stick pattern is considered a useful tool for traders to take long positions while trading.
The hockey stick pattern in terms of growth is often seen in companies when they analyse their growth with respect to different aspects such as revenues, profit margins, sales volumes, etc.
The formation of a hockey stick pattern in a company’s growth chart suggests that the firm’s growth has seen a sharp rise after being stagnant for a specific period.
Well, whether the hockey stick growth is good or not depends on the factors that have caused the growth.
While rapid growth may seem attractive, it is usually not sustainable unless the fundamental factors affecting it have changed. Rapid growth without any improvement in the fundamentals can lead to a reversal soon. In such cases, the hockey stick pattern is only a false signal.
The four stages of hockey stick growth are:
Tinkering stage: Where the business owner implements the idea and begins the business
Blade stage: Where the business slowly generates minimal revenue (When the line is almost flat)
Inflection stage: Where the revenue begins to grow
Surging stage: Where the revenue grows rapidly
The problem with following the hockey stick pattern is its inability to show whether the significant growth is real or a mere false signal. When the growth is a false indication, it can lead to incorrect decisions, causing material impact.
Hence, it is better to use the hockey stick pattern in combination with other tools, rather than in isolation.