Table of contents
Identifying trends in the stock market is one of the fundamental skills a trader must possess to be successful in stock market trades. Since stocks are subject to constant fluctuations, analysing and trading according to the trend is the only way to bring some structure to trading.
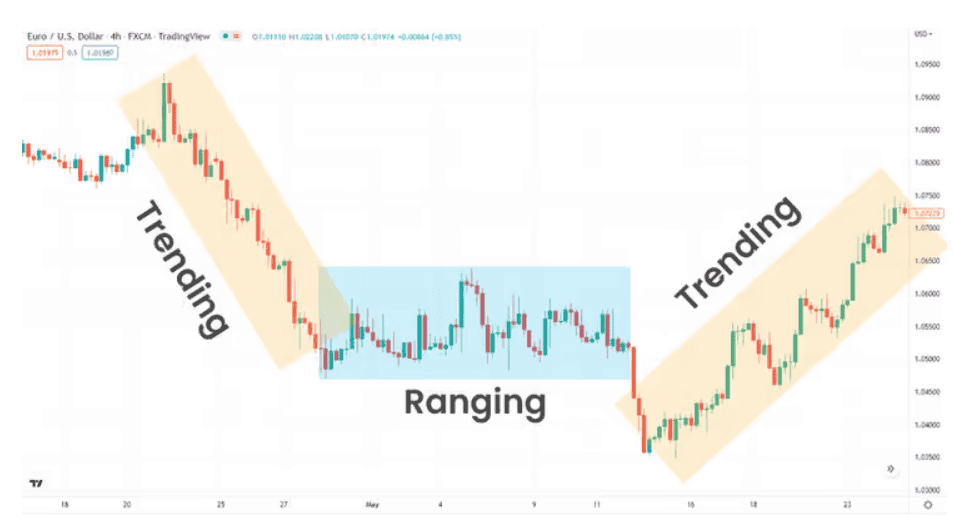
There are various kinds of trends, such as uptrends, downtrends, range-bound trends, etc. In today’s article, let us understand what the market looks like in a range-bound trend and how to identify such range-bound markets.
What is a range-bound market?
A range-bound market is where the stock’s prices trade within a particular range. It is where stocks trade in between the previous highs and lows. Since both bulls and bears fail to dominate the market, neither a new high nor a new low is created. It is a situation where the stock’s prices move sideways and fluctuate between the support and resistance levels.
- Support: The lowest price a stock can reach after it bounces upwards.
- Resistance: The highest price a stock reaches before falling downwards.
When the market starts getting dominated by bulls or bears, the stock prices break out of support or resistance levels to create a new trend. But, in a range-bound market, the absence of strength by bulls or bears causes the stock to trade within the support and resistance levels.
Range-bound market indicators
Identifying a range-bound market is essential to formulate appropriate trading strategies. Various technical indicators suggest how to algorithmically identify range bound market. Some of them are:
- Price channels
Price channels are two parallel lines between which a stock’s price fluctuates. Traders use support and resistance levels to draw these lines. Upon drawing the two lines, traders must observe the price movement of stocks for a specific period. In a range-bound market, the stock price stays between the two lines without a significant breakout.
- Bollinger bands
Bollinger’s band is a chart that is widely used among technical analysts to understand a stock’s volatility. The chart consists of three bands or lines, where the middle band is a simple moving average of the stock’s price observed for 20 days. The upper and lower lines depict standard deviations. While the middle band indicates the direction of the stock, the upper and lower bands indicate the volatility. If the gap between them is wide, the stock is more volatile and vice versa.
In a range-bound market, the stock’s price moves between the upper and lower lines. The gap between them is also narrow, suggesting a sideways market.
- Relative Strength Index (RSI)
The relative strength index is a tool that suggests the strength of a trend. The RSI value is calculated based on how the stock is trending for 14 days. The RSI value falls between 0 and 100, with 0 indicating a dominant downtrend on all 14 days and 100 indicating an uptrend on all 14 days.
An RSI under 30 is an indication of an oversold or a bearish market, and above 70 indicates an overbought situation or a bullish market. In a range-bound market, the RSI falls between 30 and 70.
- Average Directional Index (ADX)
ADX is another indicator, like the RSI, that suggests the strength of a trend. It indicates a value between 0 to 100, with 0 showing no strength and 100 showing the maximum strength.
The ADX value can either be positive or negative. When the value is negative, it shows how strong the bearish trend is. When the value is positive, it suggests the power of bullish dominance. Either way, ADX must be above 25 to show a strong trend.
A value below 25 indicates a weak trend and suggests an indecisive or a range-bound market where prices are moving sideways.
Strategies to trade a range-bound market
Once you’ve identified that a stock or index is trading in a range-bound pattern, the next step is figuring out how to profit from it. While range-bound markets may not deliver explosive trends, they offer predictable patterns and multiple trading opportunities—if you know where to look.
Let’s explore both price action-based strategies and options trading strategies suited for sideways markets.
1. Range Trading (Bounce Strategy)
This is the most basic and popular strategy for sideways markets.
- How it works: You buy near the support (bottom of the range) and sell near the resistance (top of the range).
- Ideal for: Stocks showing consistent horizontal movement with clearly defined upper and lower boundaries.
- Key tools: RSI (for identifying overbought/oversold), Bollinger Bands, Support/Resistance Zones.
Example:
If a stock keeps bouncing between ₹100 and ₹120, a trader might buy at ₹102 and sell around ₹118 repeatedly.
2. Breakout Strategy
Sometimes, a stock breaks out of the established range with strong volume, either upward or downward.
- How it works: You wait for a breakout above resistance or below support, then enter a trade in the direction of the breakout.
- Ideal for: Traders who can patiently wait and act only when momentum confirms the breakout.
- Risk: False breakouts are common. Use volume confirmation and stop-losses.
3. Short Straddle Option Strategy
- How it works: You sell both a call and a put option at the same strike price and expiry.
- When to use: When you expect the stock/index to stay around a particular price (low volatility).
- Profit zone: Maximum profit occurs if the stock closes at the strike price on expiry.
- Risk: Unlimited if the stock makes a strong move in either direction.
4. Short Strangle Option Strategy
- How it works: You sell a call and a put, but at different strike prices, both out-of-the-money.
- When to use: When you expect the stock to stay within a defined range but want a slightly wider margin than a straddle.
- Profit zone: Profitable if the stock remains between the two strike prices.
- Risk: Like the straddle, this has unlimited risk if the stock breaks out significantly.
5. Iron Condor
This is a combination of two spreads—a bull put spread and a bear call spread—designed for tight range-bound movement.
- How it works: You sell an out-of-the-money call and put, and buy further out-of-the-money call and put to limit your risk.
- When to use: Ideal for experienced traders expecting low volatility.
- Risk/Reward: Limited risk and limited reward, but high probability of profit if the market stays calm.
6. Ratio Bear Put Spread Strategy
- How it works: You buy one at-the-money put and sell two out-of-the-money puts.
- When to use: When you have a mildly bearish outlook and expect the price to stay in a limited downside range.
- Profit zone: Profitable if the underlying declines slightly, but losses can occur with a sharp drop.
- Risk: Limited on the upside, but potentially unlimited on the downside if not hedged properly.
7. Ratio Bull Call Spread Strategy
- How it works: You buy one at-the-money call and sell two out-of-the-money calls.
- When to use: When you’re mildly bullish and expect the stock to rise within a predictable range.
- Profit zone: Maximum profit if the stock ends up at the strike price of the short call.
- Risk: Risk increases significantly if the stock rallies too sharply.
How to Choose the Right Strategy?
| Market Outlook | Best Strategy |
|---|---|
| Sideways with tight range | Range trading, Short Straddle |
| Sideways with wider range | Short Strangle, Iron Condor |
| Mildly bullish | Ratio Bull Call Spread |
| Mildly bearish | Ratio Bear Put Spread |
| Expecting breakout | Breakout strategy with tight stop-loss |
Pros and Cons of Range Trading
Like any trading strategy, range trading comes with its own set of advantages and limitations. Knowing both helps you decide when and how to apply it effectively.
Pros of Range Trading
1. High Probability Setups: Once a clear range is established, price tends to respect support and resistance levels, offering repeated trading opportunities.
2. Simpler Analysis: Compared to trend trading, range trading relies on horizontal levels and basic indicators like RSI, Bollinger Bands, and moving averages.
3. Ideal for Low Volatility Markets: When markets lack momentum, trend-following strategies often fail. Range trading thrives in calm, sideways environments.
4. Quick Entry and Exit: Short holding periods and defined levels make it easier to set stop-losses and targets, minimizing emotional decision-making.
5. Works Across Asset Classes: Can be applied to stocks, indices, forex, and even cryptocurrencies during consolidation phases.
Cons of Range Trading
1. Vulnerable to Breakouts: A sudden news event or earnings report can break the range, leading to quick losses if stop-losses aren’t in place.
2. Requires Constant Monitoring: Ranges can shift or break quickly. Traders need to be alert and adjust their levels regularly.
3. False Signals Are Common: Wicks and fake-outs around support and resistance can trap traders on both sides of the range.
4. Not Suitable for All Market Phases: Fails in trending markets. Using range trading when momentum builds up can result in missed opportunities or losses.
5. Limited Profit Potential: Since the price oscillates within a range, profits are often smaller compared to trending market strategies.
Bottomline
A range-bound market is where stock prices move within specific price limits. It is where stock prices do not break the support or resistance levels to create new highs or lows.
A range-bound market occurs when neither bulls nor bears are dominant, and the market is moving sideways. Identifying a range-bound market and the ranges is crucial in formulating strategies to trade with the trend. Traders must use a combination of the indicators available to confirm whether the market is range-bound, before taking positions.
Want to test your trading skills without risk? Use StockGro’s virtual trading platform and refine your strategies. Start with virtual trading app now!FAQs
To identify support and resistance levels, determine the time period of your analysis. Then, check the historical prices to identify the highest and lowest prices that the stock has reached. Look for a significant pause in price rise or decline to identify resistance and support levels respectively.
To know whether the market is range-bound or trending, you must analyse the historical price pattern of stocks. If you see that the price is constantly rising, it indicates an uptrend. When the price is consistently falling, it indicates a downtrend. When the price is not fluctuating either way and showing slight movements within a range, it is a range-bound market.
While there are various technical indicators that help in identifying a range-bound market, the easiest way to identify the ranges is by checking the stock’s highest and lowest price during a specific period.
Range trading is profitable, however, the profits are not as high as a trader can earn in day trading. The profits from range trading are usually limited since trading happens only within a specific range. Losses, however, can be unlimited when there is an unexpected breakout.
A range-bound market in forex is where a currency pair trades between a specified upper and lower limit. The exchange rate of the currency pair fluctuates between the support and resistance levels in range-bound forex trading. EUR/CHF is one of the most popular range-bound currency pairs.