Table of contents
Are you tired of watching the stock market fluctuate without understanding why? Stock market analysis is the process of evaluating and analysing the performance of stocks to make investment decisions. There are two main types of stock market analysis: fundamental and technical.
Buckle up, because we’re about to take you on a journey through the world of technical analysis of stocks and give you the tools you need to take control of your stock market investments.
What is technical analysis (TA)?
Technical Analysis involves evaluating securities using past price and volume data to identify patterns and make investment decisions. It uses chart patterns, trend lines, and other technical indicators to predict future price movements.
In the world of TA, everything is a pattern, and the future is waiting to be uncovered. It is based on the premise that all market data, including past prices, are reflected in current market prices and that future price movements can be predicted based on historical patterns.
What is fundamental analysis (FA)?
Fundamental analysis is a method of evaluating a stock based on the financial and economic health of the underlying company. It’s like investigating a company’s background to determine whether it’s a good investment or not.
Fundamental analysis peeks into a company’s report card by examining crucial aspects such as earnings, revenue, assets, and liabilities to gauge its potential and determine its future value.
Difference between technical analysis (TA) and fundamental analysis (FA)
| Aspect | Fundamental analysis | Technical analysis |
| Definition | Evaluates securities by trying to measure their intrinsic value. | Observes patterns in the weekly and monthly trading volumes and prices of the stock |
| Timeframe | It is often used in investing strategies with a longer time horizon. | Popular for trading tactics with a shorter time horizon. |
| Focus | Analyses financial statements, management, industry conditions, and other factors. | Analyses past market data, primarily price and volume, to predict future moves. |
| Data Used | Economic reports, financial statements, industry analysis, and news events. | Past price charts, trade volume, and additional market data. |
| Objective | To evaluate a stock’s real worth and potential for development. | Use pricing trends to determine whether it is an appropriate time to enter or exit the market. |
| Type of Trader | Suited for long-term position traders. | Suited for swing traders and short-term day traders. |
Importance of technical analysis chart patterns
Technical Analysis is used by traders to make informed trading decisions, as well as by portfolio managers to determine the best time to buy and sell securities.
Technical analysis can be used in many ways, including
- Predicting future price movements: By analysing price action and volume, traders and investors can make informed predictions about a stock’s future price movements.
- Identifying market trends: Technical analysis can help traders and investors identify short-term and long-term market trends.
- Determining entry and exit points: Technical analysis can determine the best times to buy or sell a stock.
- Improving portfolio management: Using technical analysis, traders and investors can make informed decisions about which stocks to hold, when to sell, and when to buy.
- Determining support and resistance levels
- Making buy and sell decisions based on chart patterns and indicators.
What is OHLC?
OHLC stands for Open, High, Low, and Close. These are the four key data points that technical analysts use to create charts and make predictions about a stock’s price.
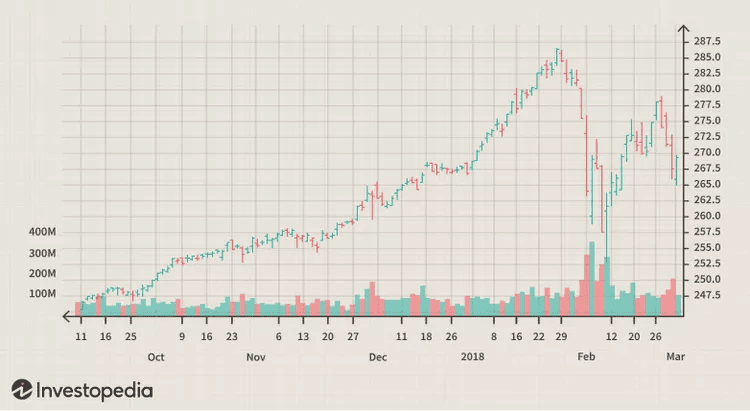
The open is the price of the stock at the beginning of the trading day, the high is the highest price that the stock reached during the day, the low is the lowest price that the stock reached during the day, and the close is the price of the stock at the end of the trading day.
Stock market technical analysts use this information to identify potential stock price trends.
What are the key terms in TA?
If you’re new to technical analysis, some terms and concepts may be confusing. Here are some key terms to know:
- Support and resistance: The levels at which a stock’s price tends to either stop declining or start rising.
- Trend lines: Straight lines that connect a stock’s highs or lows and help to identify trends in the stock’s price.
- Candlestick charts: A type of chart that provides information about a stock’s price and volume using the shape and colour of candlesticks.
Conclusion
In conclusion, stock market analysis is a fascinating and ever-evolving field. There are many methods and indicators to choose from, each with its own strengths and weaknesses. Whether you’re a seasoned investor or just starting out, it’s essential to research and find the best methods for you.
FAQs
The four basic principles of technical analysis are:
Market action discounts everything: This principle asserts that all known and unknown information is reflected in the market price.
Prices move in trends: Technical analysts believe that prices move in identifiable trends that are typically more likely to continue than to reverse.
History tends to repeat itself: Market psychology is predictable, and this is reflected in chart patterns and trends that tend to repeat over time.
Patterns can be identified: Through various charting tools and indicators, traders can identify patterns that help predict future price movements.
Analysing a stock involves both fundamental and technical analysis. Fundamental analysis looks at a company’s financial health, management quality, market position, and growth prospects. Technical analysis, on the other hand, focuses on studying price movements, volume, and historical patterns to forecast future price action. In India, analysts often combine these methods with a keen eye on market sentiment, regulatory changes, and macroeconomic factors to make informed decisions.
RSI 6 12 24 refers to the Relative Strength Index calculated over different time frames: 6, 12, and 24 periods. The RSI is a momentum oscillator that measures the speed and change of price movements. An RSI over 70 typically indicates overbought conditions, while below 30 indicates oversold conditions. The different time frames provide insights into the short-term (6-day), medium-term (12-day), and longer-term (24-day) momentum of a stock’s price.
There is no single technical indicator with the highest accuracy as effectiveness varies with market conditions and individual trading strategies. However, some of the most respected and widely used indicators include the Moving Average Convergence Divergence (MACD), Relative Strength Index (RSI), and Stochastic Oscillator. Traders often use a combination of these indicators to improve the accuracy and confirmation of trading signals.
The accuracy of technical analysis can vary widely. While some studies suggest that technical analysis can be quite accurate, it is not infallible. The success of technical analysis depends on the skill of the analyst, the quality of the data, and the complexity of the market conditions. Backtesting strategies can yield accuracy above 65%, which is considered positive, especially with a favourable risk-reward ratio. However, keep in mind that no technical analysis can predict market movements with 100% certainty.