Table of contents
Today, we’re talking about a pattern traders often use called the “inverted head and shoulders.” It sounds fancy, but it’s really just a helpful way to predict what might happen in the market. And the best part? It’s simpler than you think!
Let’s read more.
What is an inverted head and shoulders pattern?
The inverted head and shoulders pattern occurs when the price of a stock or asset makes three distinct moves: a dip, a deeper dip, and then another dip that mirrors the first. This creates an upside-down human head and shoulders pattern.
You may also like: Insights into market trends and reversals using Inverted Hammer
Components of the pattern
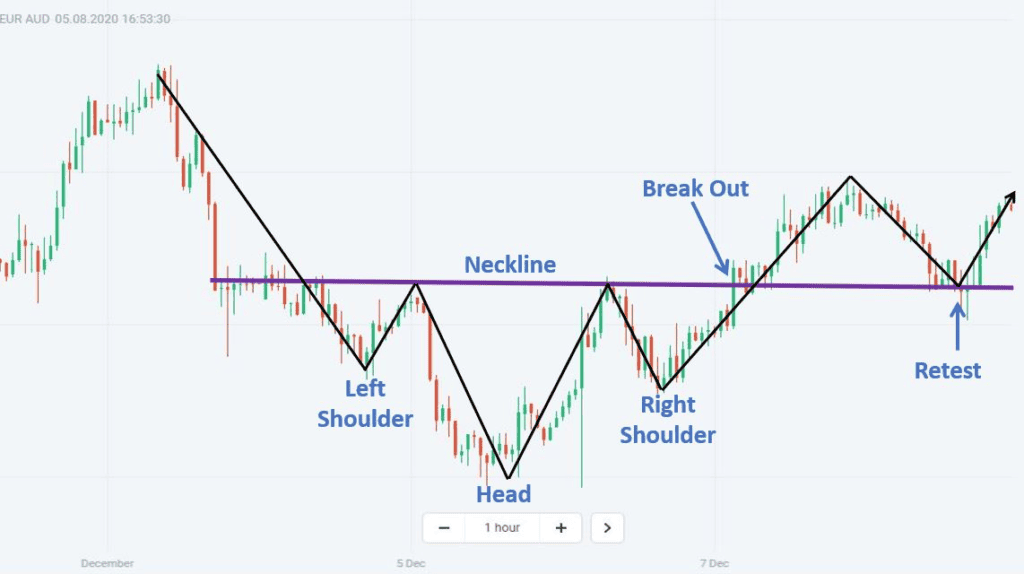
- The left shoulder
This is the first dip in the price. Traders often see this as a typical downturn, but little do they know that it’s the start of something more significant.
- The head
This is where many investors might panic or sell, thinking the asset is on a downfall. If you see an inverted head and shoulders design, this may be a good purchase.
- The right shoulder
The third dip is usually similar in depth to the left shoulder. When this occurs, savvy traders are on high alert for a breakout, i.e., a significant price increase.
- The neckline
Connecting the tops of the two shoulders is what traders call the “neckline.” If the price breaks above this level, the asset should continue to rise.
How to spot the pattern
- Look for a downtrend: The pattern typically forms after an extended period of declining prices.
- Identify the shoulders and head: Watch for the three distinct dips we discussed earlier.
- Locate the neckline: Draw a straight line connecting the peaks of the shoulders. This is your neckline.
| Part | What to Look for |
| Left shoulder | First dip in the price |
| Head | Deeper, central dip |
| Right shoulder | Second, usually symmetrical, dip |
| Neckline | Line connecting tops of shoulders |
How to use the pattern for trading
- Calculate the target price
Calculating the inverse head and shoulders pattern target can give you an idea of how high the price might go. Measure the distance from the neckline to the bottom of the head and add that number to the neckline. This will give you a good estimate of the target price.
- Be patient
It’s crucial to wait for the price to break above the neckline to confirm the pattern. Premature trading can result in losses.
- Set stop-loss orders
Setting a stop-loss order just below the right shoulder can help minimize losses in case things don’t go as planned.
Real-world examples and applications
| Asset Type | Trigger Events for Pattern Formation |
| Stocks | Earnings reports, product launches |
| Commodities | Economic data, currency fluctuations |
| Forex | Geopolitical events, economic indicators |
| Bonds | Interest rate changes, economic policy |
Benefits and limitations
Benefits
- Easy to spot: Once you know what to look for, this pattern is relatively straightforward to identify.
- Reliable: It’s one of the more dependable indicators of a bullish trend.
- Versatile: This pattern can be found in various time frames and markets.
Also Read: What do these symmetrical triangle patterns suggest?
Limitations
- False signals: While generally reliable, the pattern can occasionally give a false breakout signal.
- Requires confirmation: Traders often wait for other indicators like trading volume to confirm the pattern.
- Not a guarantee: The financial markets are influenced by a multitude of factors, and no single pattern can predict them with 100% accuracy.
Practical tips for beginners
- Practice spotting: Before you risk any real money, practice spotting this pattern on historical charts or paper trading platforms.
- Pair with other indicators: For better accuracy, use other technical indicators like the Relative Strength Index (RSI) or Moving Average Convergence Divergence (MACD).
| Tips for Beginners | Description |
| Practice spotting | Use historical charts to identify patterns |
| Pair with other tools | Combine with RSI, MACD, etc., for improved accuracy |
| Keep learning | The more tools you know, the more versatile you become in trading |
Conclusion
The inverted head and shoulders pattern is a tried-and-tested method that traders have been using for years. The pattern suggests that the value of an asset is likely to go up, so it’s a good idea to pay attention.
So, the next time you’re finding it difficult to glance through the complex graphs and data, keep an eye out for the distinct shape of an inverted head and shoulders pattern. It could be your key to making a profitable trade!
FAQs
The inverse head and shoulders pattern is the opposite of the head and shoulders pattern and indicates that the price of an asset may be about to reverse from a downward to an upward trend. The design resembles an inverted head and two shoulders with three consistent peaks and lows.
When it comes to bullish reversal patterns, the inverse head and shoulders pattern is usually considered to be a reliable pattern. In order to provide traders and analysts with important data on possible trend reversals, it is used by both groups.
The inverse head and shoulders pattern is bullish. It signals the end of the downward trend and the start of the upward trend. When the upward trend breaks over the resistance line, traders take a long position and wait for the volume to rise and confirm the trend has changed.
One of the most common reversal patterns is the head and shoulders pattern. It is crucial to keep in mind that it follows an uptrend and, when complete, often indicates a significant trend reversal. Although symmetrical shoulders on the left and right are ideal, this is not a requirement.
You can see head-and-shoulders patterns, which consist of a central peak surrounded by two smaller peaks, across an intraday stock chart. Although these triple-peaked chart patterns are among the simplest to interpret wrongly, they may be useful indicators of a significant trend reversal.