Table of contents
How do you make investment decisions? What are the influencing factors? Well, the factors may be many and may differ for each investor. But one of them that we all consider is the return the investment brings us.
One such tool that helps particularly with analysing bond returns is the concept of yield. In today’s article, we will learn about yield, the inverted yield curve and its significance.
What is yield in the bond market?
Yield in the bond market refers to the returns an investor earns from a bond. It is represented as a percentage of returns on the bond price.
There are different types of yield. While coupon yield revolves around the annual interest or returns a bond generates, yield to maturity (YTM) determines the return a bond generates throughout its life.
Determining a bond’s yield and comparing it with other bonds is one of the most crucial activities a bond investor must do before investing in a particular bond.
Inverted yield curve
Before understanding an inverted yield curve, let us learn what yield curves are.
A yield curve is a graph showing yields of different bonds with varying maturity dates. The yield levels of both short-term and long-term bonds are plotted on a graph that helps investors analyse how bond returns vary with maturity timelines. The slope of the curve reacts to various economic factors, which makes the yield curve a significant indicator of the economy.
Yield curves are of different types. One of the types is an inverted yield curve.
The history of inverted yield curves goes back to 1986 when Mr. Campbell Harvey, a Canadian economist, coined the term in his PhD thesis. Usually, a yield curve is upward-sloping, but an inverted yield curve has a downgradient.
The typical characteristic of a bond market is that long-term bonds yield higher returns. But, the inverted yield curve occurs when the economy is against this. It appears when bonds with longer maturity earn less than those with shorter maturity periods.
Causes of the inverted yield curve
The inverted yield curve and interest rates are closely related. The occurrence of an inverted yield curve is due to short-term bonds offering better interest than long-term bonds. It usually happens when the number of investors choosing long-term bonds increases, thereby increasing its demand.
As most of us may know, bond prices and yield move against each other. When the bond’s demand increases, its value increases, too. However, the coupon or interest rate on bonds is fixed. So, the interest earned on the bond falls. This affects the overall yield of long-term bonds, making short-term bonds more attractive.
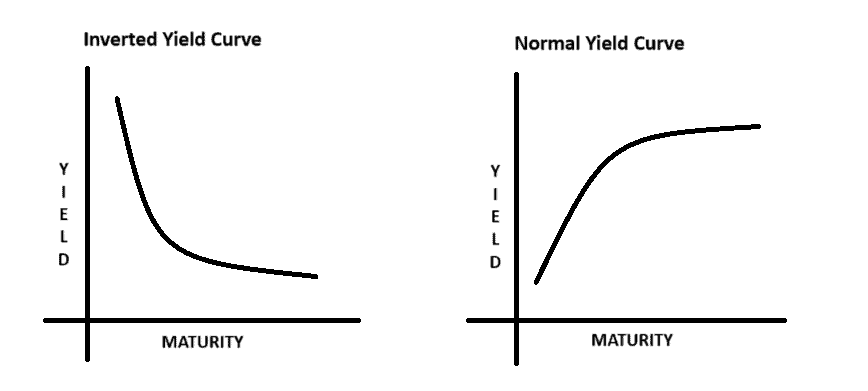
A normal yield curve vs an inverted yield curve
A normal yield curve appears when the market follows its typical pattern where long-term bonds pay more interest than short-term ones.
| Normal yield curve | Inverted yield curve |
| Long-term bond returns > Short-term bond returns | Short-term bond returns > Long-term bond returns |
| Upward sloping curve | Downward sloping curve |
| It is usually an indication of a growing environment. | Though not always, an inverted yield curve sometimes indicates potential economic downfall. |
How do we take advantage of an inverted yield curve?
Identifying an inverted yield curve pattern can help investors make significant investment decisions:
- Bank loan interest rates are highly dependent on the bond market. When an inverted yield curve appears, loan interest rates decrease, which gives borrowers an option to refinance their loans.
- While short-term bonds may seem more attractive since their yields are higher, investors must go a step further to understand the cause. An inverted yield curve indicates pessimism about short-term bonds. So, the inverted curve is a hint for investors to stay invested in long-term bonds.
- The inverted curve is an indication of a potential downfall. Investors must consider this as a warning and invest in defensive instruments whose values stay stable irrespective of the market condition.
Bottomline
An inverted yield curve represents the yields of different bonds in the bond market. When an inverted yield curve appears, it suggests that short-term bonds provide higher yields than long-term bonds.
The curve acts as a useful tool that helps investors assess the bond market thoroughly. It warns investors about the potential negativity and downfall in the economy, based on which they can make informed investment decisions and strategies.
FAQs
An inverted yield curve’s impact on banks and their profits is significant. During an inverted yield curve, bank interest rates on deposits increase, and interest rates on loans decrease. This affects the bank’s net interest income and its profitability. The changing interest rate may also reduce the demand for loans. Besides, the inverted yield curve is a warning of a potential economic slowdown, which can increase loan defaults and credit risks.
Interest rates and bond prices are inversely related. When interest rates in the market rise, bond prices fall. This is because, existing bonds have a fixed coupon rate, which makes them less attractive as compared to new bonds in the market with higher interest rates. Hence, the market value of existing bonds decreases.
Reading a yield curve depends on the direction of the slope. An upward curve indicates a normal bond market where short-term bonds yield lower returns than long-term bonds. A downward curve indicates an inverse bond market, where short-term bonds yield higher interest than long-term bonds. This is an indication of a possible economic slowdown.
Often, the normal yield curve with an upward slope that occurs when the returns of long-term bonds are higher than that of short-term bonds, is considered a good yield curve. This is because the normal yield curve shows the normal functioning of the market and indicates potential economic growth.
Yield curve risk is also called interest rate risk. It is the risk of earning lower revenues when the slope of the yield curve changes. The risk revolves around the potential loss of interest when factors influencing a bond’s yield change in the market.