In the world of financial markets, the long-legged Doji stands as a mysterious signal, a pause in the constant tug-of-war between buyers and sellers. With its distinctive appearance and potential to indicate trend reversals, understanding the long-legged doji is like deciphering the market’s hidden language.
In this article, we uncover its role in technical analysis and trading strategies.
Also read: Essential guide to candlestick patterns for beginners
What is a long-legged doji?
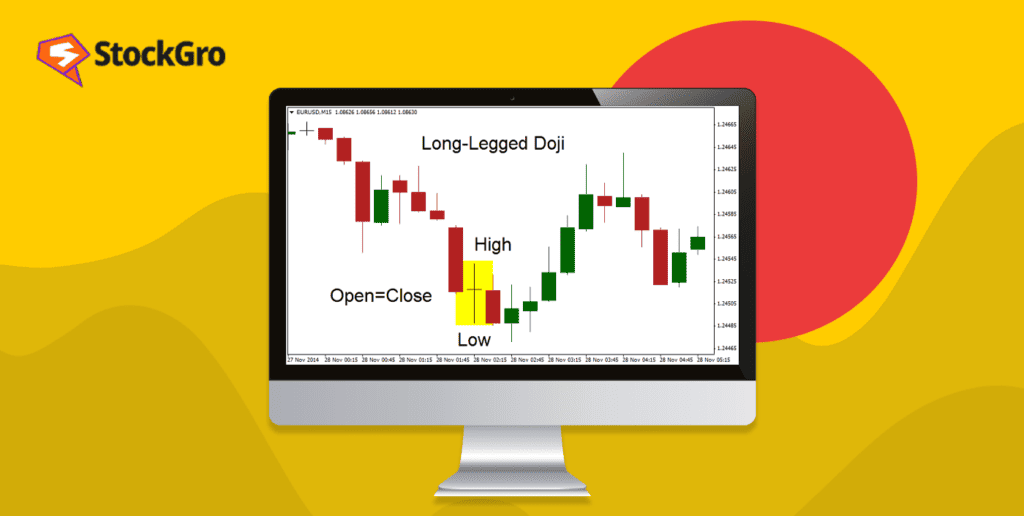
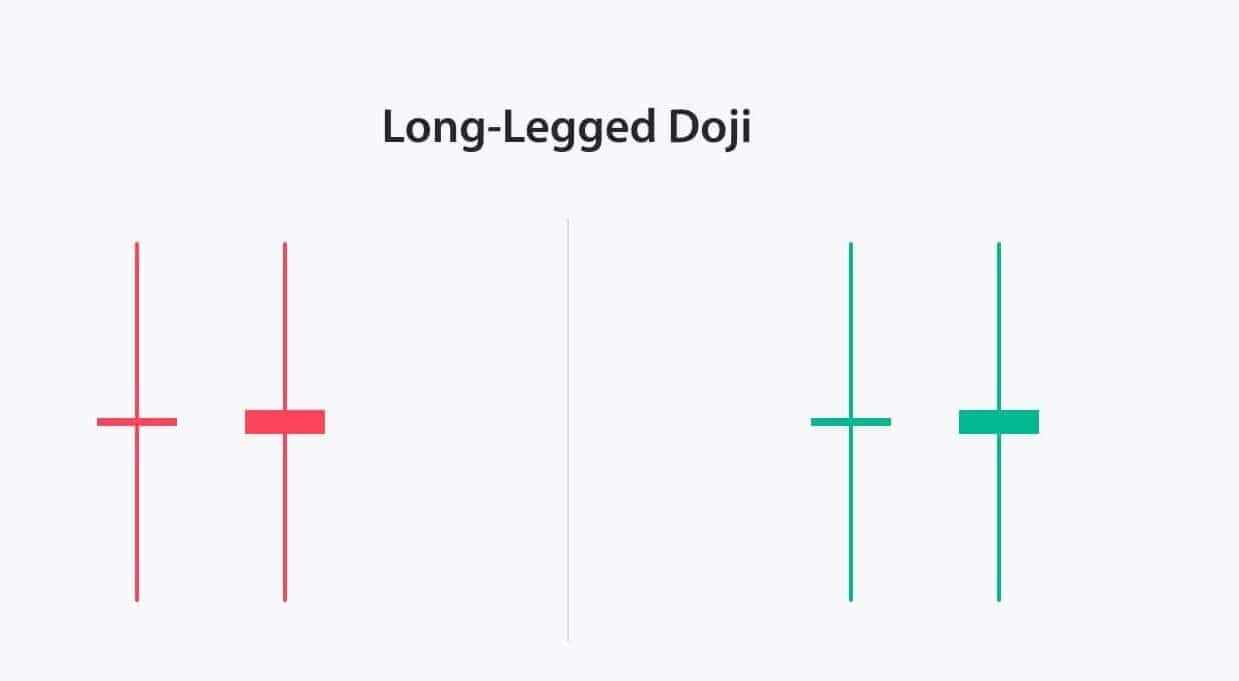
A long-legged doji is a chart pattern on a price chart that shows uncertainty in the market.
This pattern emerges when the opening and closing prices are almost identical, and there are extended upper and lower “wicks” or shadows. This pattern suggests a battle between buyers and sellers, but neither side gained control.
It often indicates a potential reversal in the trend, but traders usually wait for confirmation from other indicators before making decisions. In simple terms, it’s like a sign that says, “The market can’t decide which way to go right now.“
The psychology behind the pattern
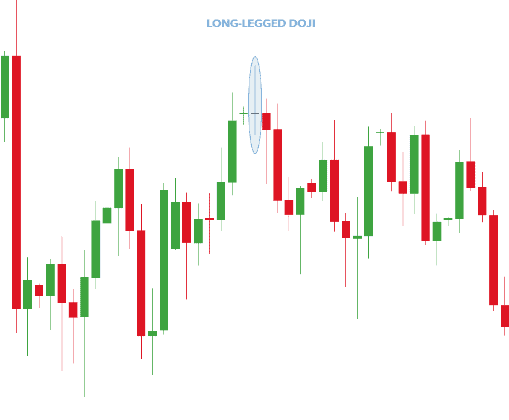
A long-legged doji represents uncertainty in the future price direction of a security. It often appears at the start of a consolidation phase, where the price forms several long-legged dojis before entering a narrower pattern or changing its trend.
Long-legged dojis are most meaningful during strong uptrends or downtrends, signifying a potential trend reversal as supply and demand reach a balance.
For instance, in an uptrend, where prices usually close higher, a long-legged doji shows a battle between buyers and sellers resulting in no clear winner, indicating changing sentiment.
As the long-legged doji signifies uncertainty, traders can wait for the price to break above the doji’s high or low. A move above suggests a long entry, while a move below indicates a short entry.
When entering long after a doji breakout, place a stop loss below the doji or consolidation. For short entries, place the stop loss above the doji or consolidation.
Also read: What is spinning top candle and what does it indicate?
Long-legged dojis are more reliable near significant support or resistance levels. For instance, if a long-legged doji forms near a major resistance level in an uptrend, it may indicate a higher chance of a price drop if it breaks below the doji’s low.
Long-legged dojis lack specific profit targets. Traders can use technical indicators, moving averages, or employ a fixed risk/reward ratio to determine when to take profits.
Long-Legged Doji Example
Imagine a day when Reliance Industries’ stock opens at ₹2,500. During the trading session, enthusiastic buying pushes the price up to ₹2,600. However, selling pressure then drives it down to ₹2,400.
By the market’s close, the price returns to ₹2,500, exactly where it started. This results in a candlestick with long upper and lower shadows and a tiny or non-existent real body, indicating that neither buyers nor sellers dominated the day.
Such a pattern suggests a balance between bullish and bearish forces, often preceding a potential shift in the stock’s trend.
How is the long-legged doji candlestick pattern formed?
A long-legged doji pattern forms when a financial asset’s opening and closing prices are nearly identical, creating a horizontal line. However, during the trading session, the price experiences significant fluctuations, leading to long upper and lower shadows.
This pattern signals a tug-of-war between buyers and sellers, indicating market indecision.
The extended shadows demonstrate that, although there was volatility, the price ultimately returned to its starting point. Traders use the long-legged doji to recognize potential turning points in the market, particularly when it appears after a sustained trend.
Difference between classic doji and long-legged doji
| Factors | Classic doji | Long-legged doji |
| Body size | The prices are identical, forming a very small or non-existent body. | This has a more noticeable body, with open and close prices that are still close but not as tightly clustered as in a classic doji. |
| Shadow length | This has short upper and lower shadows, indicating limited price volatility during the trading session. | This displays long upper and lower shadows, signifying greater price volatility within the trading session. |
| Market sentiment | It represents a state of market indecision and potential reversal but may not indicate as much uncertainty as a Long-Legged Doji. | It indicates a more pronounced state of market indecision, with stronger battles between buyers and sellers, suggesting higher uncertainty. |
| Interpretation | It is interpreted as a reversal signal when it appears after a trend. It suggests a balance. | It can signal not only potential reversals but also heightened volatility and the potential for significant price swings in either direction. |
Long-Legged Doji Trading Considerations
When considering trading based on a Long-Legged Doji, keep the following in mind:
- Market Context: The significance of this pattern increases when it appears after a strong uptrend or downtrend, suggesting a potential reversal.
- Confirmation: It’s prudent to wait for the next candlestick to confirm the market’s direction before making a trade decision.
- Support and Resistance Levels: The pattern is more reliable when it forms near established support or resistance levels, indicating a possible change in price direction.
- Volume Analysis: High trading volume during the formation of the Long-Legged Doji can strengthen the likelihood of a subsequent trend reversal.
Considering these factors can improve trading decisions when dealing with the Long-Legged Doji pattern.
Trading strategies using the long-legged doji
Reversal strategy: After a long-legged doji forms, wait for confirmation from the next candle. If it reverses the prior trend, consider entering in that direction. Set stop loss.
Continuation strategy: If a long-legged doji appears within an ongoing trend, wait for confirmation from the following candle. Enter in the trend’s direction upon confirmation. Place stop loss accordingly.
Range-bound strategy: Long-legged dojis often occur during consolidation phases. Within the consolidation range, establish your take-profit and stop-loss levels.
Indicator combination: Enhance accuracy by combining long-legged doji signals with indicators like moving averages. Confirm signals when indicators align.
Risk management: Always implement proper risk management, including establishing stop-loss orders.
Also read: What does the Doji candle tell us about the market?
Below given is an example of a recent occurrence of the long-legged doji in the NSE index dated April 12, 2023.
The market staged a rebound with higher trading volumes, indicating a potential reversal from the previous day’s bearish trend and a continuation of the upward trend in the medium term. Traders should await confirmation before considering new long positions.
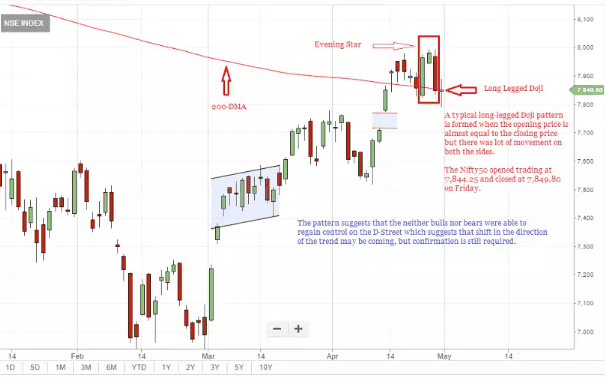
Source: Economic Times
Risks involved
False signals: Long-legged doji patterns can sometimes mislead traders, as they indicate market indecision but not the subsequent direction.
Market volatility: The appearance of a long-legged doji during highly volatile market conditions can result in erratic price movements, increasing the risk of unexpected losses.
Confirmation needed: Relying solely on long-legged doji patterns without confirmation from other indicators or technical analysis may lead to erroneous trading decisions.
Whipsaw effect: In choppy or sideways markets, frequent long-legged doji patterns may result in whipsaw trades, causing losses due to sudden reversals.
Overtrading: The temptation to trade every long-legged doji can lead to overtrading, increasing transaction costs and potential losses. Traders should exercise restraint and select setups carefully.
Bottomline
It is vital to remember that the long-legged doji is not a standalone guarantee of success.
To harness its power effectively, traders must combine it with a solid understanding of market conditions, additional technical indicators, and prudent risk management.
Ultimately, the long-legged doji offers a window into the complex psychology of market participants, providing opportunities for astute traders to navigate the ever-changing tides of financial markets with greater confidence and precision.
FAQs
How do you interpret a Long Legged Doji in technical analysis?
A Long-Legged Doji in technical analysis signifies market indecision, where both buyers and sellers have pushed prices significantly, but the session closes near the opening price.
What does a Long Legged Doji indicate about market sentiment?
This pattern reflects uncertainty among traders, indicating that neither bulls nor bears have control, which can precede a market reversal or consolidation.
How can a Long Legged Doji signal a potential reversal?
Appearing after a strong trend, a Long-Legged Doji suggests the prevailing trend may be losing momentum, potentially signaling a reversal if confirmed by subsequent price action.
What are the key differences between a Long Legged Doji and other Doji patterns?
Unlike other Doji patterns, such as the Standard Doji with short shadows, the Long-Legged Doji features long upper and lower shadows, indicating higher volatility and indecision.
How do traders use the Long Legged Doji for making trading decisions?
Traders often await confirmation from the next candlestick before making decisions, using the Long-Legged Doji as an alert to potential changes in market direction.