Table of contents
There is more to stock market investment than just predicting which companies will go up and which will go down. Additionally, as an investor or trader, you should be aware of the market’s overall performance.
For example, thousands of stocks are traded every minute on the NSE. While some are falling, others are rising. That’s the market breadth in a nutshell and in this particular case, it is the market breadth on NSE.
But what exactly does that mean? Let us break it down in simple terms.
What is the market breadth?
A group of technical indicators known as “market breadth” measures the extent to which stock index prices have increased or decreased. So, to measure the Nifty market breadth, you need to take the total number of stocks witnessing rises in prices in the index and compare the market breadth to the number of stocks experiencing price declines.
The stocks are traded on the stock market and are included in a particular index and the index’s changes reflect investors’ general state of mind in the share market.
When more equities are going up than down, it’s called positive market breadth, which means that the market momentum is controlled by the bulls, which is good news for index price growth. On the other hand, when there is an excessive number of declining securities, it’s a sign that the stock index is about to go down.
The breadth of the market is only one piece of the puzzle. Other technical indicators may be included in this report, such as trading volume. Market breadth helps traders forecast future price reversals based on the stock index.
Features of market breadth index
- The quantity of growing and declining issues
A significant component of market breadth is the number of rising and dropping issues. This is the sum of all equities that experienced price increases or decreases. By comparing these numbers, analysts can tell whether the market is driven by positive or negative sentiment.
- Recent highs and lows
Another aspect of the market’s breadth is the comparison of equities that have reached new 52-week highs against those that have dropped to new lows. This data helps provide a picture of the market’s strength over a long period, which is essential for understanding the scope of the sector as a whole.
- Number of growing and decreasing volumes
When calculating the total number of issues and measuring market breadth, the volume of shares traded on rising and declining issues is also included. The volume data influences the price fluctuations, which provides a deeper analysis of market sentiment.
What does market breadth indicate?
Retail investors and traders use market breadth when assessing the state of the index. The market breadth could be an effective, if not perfect, indicator of future index price hikes. It may also serve as an indicator of a price drop in the future.
When there are more soaring stocks than declining ones, a phenomenon known as positive market breadth takes place. Overall, it verifies that the values of individual stocks within the index have risen, demonstrating that the market attitude is favourable.
As the number of companies seeing a decline in share price increases, negative market breadth emerges. As the stock index falls, it shows that market sentiment is generally negative.
Although market breadth indicators are helpful, they may not truly depict the market. They may be unable to predict future price reversals or other significant events in the market. Alternatively, the market’s breadth can indicate a reversal earlier than it should.
A confirmation will be given if there is a rise in the index and favourable signs of market breadth. In contrast, divergence is shown when the index is increasing but the market breadth is unfavourable or the other way around. Most traders consider confirmation of divergence as a crucial component when evaluating the indicator’s reliability.
How to measure market breadth?
There are several different broad indicators available today, and they all rely on different equations and techniques of calculation. For some of them, the value is added or removed from the preceding value daily; this is called a cumulative effect. The non-cumulated time that provides the data point is used in other cases.
If you’re a beginner trader, the best way to determine breadth is by considering the decline and advance lines. Examples of cumulative indicators are the numbers of fluctuating stocks, calculated by adding or subtracting the most recent advancements from an initial value.
Types of Market Breadth Indicators
Market breadth indicators offer insights into how many stocks are actually participating in a market move. While an index might show a strong rally or decline, breadth indicators reveal whether that move is being driven by the broader market or just a few large-cap names.
1. Advance-Decline Line (A/D Line)
This tracks the difference between the number of advancing stocks (stocks that closed higher) and declining stocks (stocks that closed lower). A rising A/D line supports a bullish trend, while divergence between the index and the A/D line could signal weakening momentum.
2. Advance-Decline Ratio
This ratio compares the number of advancing stocks to declining ones. A value above 1 indicates that more stocks are rising than falling, signaling bullish breadth.
3. New Highs vs. New Lows
This measures how many stocks are making new 52-week highs versus 52-week lows. In a strong bull market, the number of new highs should outweigh new lows by a significant margin.
4. McClellan Oscillator
This is based on exponential moving averages of net advances. It’s used to identify short-term momentum and potential reversals by analyzing the speed and direction of market breadth.
5. TRIN (Arms Index)
TRIN compares the advance/decline ratio to the volume of advancing/declining stocks. A TRIN value below 1 indicates more buying pressure, while a value above 1 signals selling pressure.
Using Market Breadth in Trading
Market breadth isn’t just an analytical tool—it’s a strategic edge. Traders and investors use it to gauge the strength behind price movements and make informed decisions.
Confirming Trends
If a stock index is rising but only a few stocks are contributing to the gains, the rally may lack strength. Conversely, a strong uptrend supported by a broad number of advancing stocks signals a healthier market.
Spotting Reversals
Deteriorating breadth in a rising market can be an early warning of a potential reversal. If fewer stocks are participating in the rally, it might be time to take a more cautious stance.
Detecting Market Strength
Even in sideways markets, strong breadth can hint at a breakout. When a large number of stocks are moving higher despite the index staying flat, it often precedes an upward breakout.
Identifying Divergences
Divergence between price and breadth indicators can alert traders to weakening trends. If the index is making new highs but the A/D line is flat or falling, it could indicate underlying weakness.
Challenges of Market Breadth Analysis
While market breadth provides valuable insight, it’s not without limitations. Understanding its challenges can help you use it more effectively.
Lagging Nature
Many breadth indicators are based on moving averages or cumulative data, making them inherently lagging. This can lead to delayed signals in fast-moving markets.
Misleading During Extreme Sentiment
In periods of market euphoria or panic, breadth indicators can become less reliable. For instance, during a panic sell-off, breadth might look extremely negative, even if a bottom is near.
Overreliance
Using breadth indicators in isolation can be risky. They should be used alongside price action, volume, and other technical indicators to build a complete picture.
Sector Imbalances
Indices like the Nifty or S&P 500 may be heavily weighted toward a few sectors. If only one sector is driving the gains or losses, breadth indicators may present a skewed view of overall market health.
Conclusion
Market breadth refers to a group of technical indicators used by investors to evaluate the performance of a particular stock index. You may use this data to back up your assumptions about the price action.
However, remember that you may only calculate that the breadth indicators can only use indexes, not individual stocks.
FAQs
The breadth of the market theory is a technical analysis tool that measures the number of stocks advancing versus those declining to assess the overall strength of the market. It’s based on the premise that broad participation by stocks in a market advance or decline is a sign of a strong and sustainable trend. If more stocks are advancing, it’s generally seen as a bullish signal for the market, indicating widespread optimism among investors.
The depth of stock refers to the volume of buy and sell orders at various price levels for security, indicating its liquidity. A deep market can absorb large orders without significant price changes. The breadth of stocks measures how many stocks are participating in a market move, reflecting the robustness of a trend. A broad market move with many stocks participating is considered strong and likely to continue.
DOM, or Depth of Market, is a real-time display of the volume of buy and sell orders at different price levels for a security. It provides traders with insight into the supply and demand dynamics of the market, helping them predict price movements and identify liquidity. A deeper market, with more orders at each price level, suggests greater liquidity and stability.
Low market breadth means that a smaller number of stocks are advancing while a larger number are declining, which can indicate a weak market. It suggests that the upward movement of an index might not be broadly supported and could be driven by only a few stocks. This condition can signal a potential reversal or slowdown in the market’s upward trend.
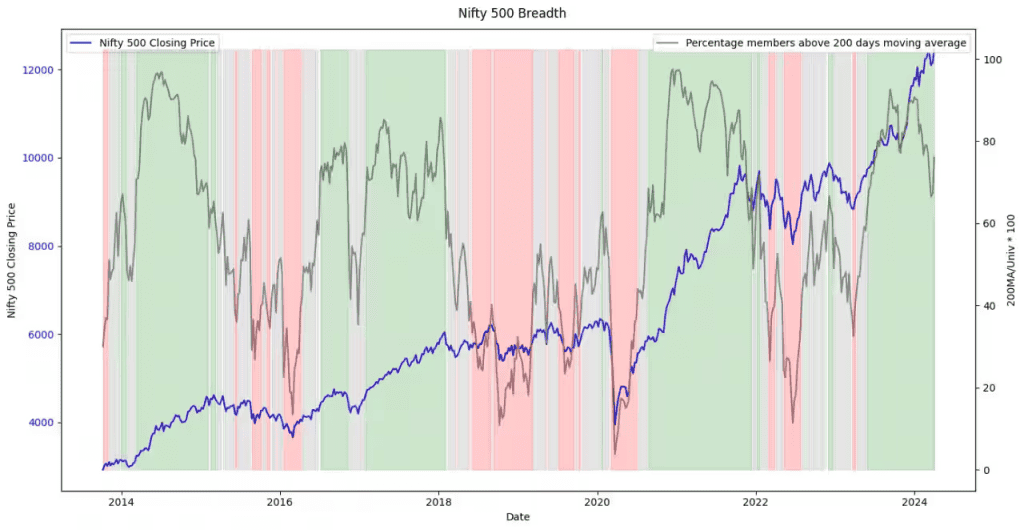
The best market breadth indicator can vary depending on the trader’s strategy and market conditions. Commonly used indicators include the Advance/Decline Line, McClellan Oscillator, and the Percentage of Stocks Above a Moving Average. These indicators help traders gauge the internal strength of the market and predict future movements. They can signal whether a market trend is likely to continue or reverse.