Table of contents
The stock market is highly volatile and constantly surprises traders with unexpected price fluctuations. One way, however, to keep a tab on these fluctuations is to analyse the trend and forecast how the future may look. This is immensely important as most trading strategies rely on past trends and forecasts.
One of the most popular ways of technically analysing stock market trends is using candlestick patterns. Today, we will discuss one such pattern, the piercing candlestick, its formation and interpretation.
What is a piercing line pattern?
Candlesticks, as we already know, depict four price points of stocks – Opening price, closing price, high and low. Each candlestick type differs from another in size or pattern based on how the stock’s prices have been moving.
The piercing line is one such candlestick formed during a potential bullish reversal. It is a pair of two candles, with the former being bearish and the latter being bullish. It usually occurs after a downtrend in the market, where the second candle indicates a reversal and the start of an uptrend.
Spotting the piercing pattern
Not every candlestick pair indicates a piercing pattern if it is a red candle followed by a green one. Here are some specific features of a bullish piercing pattern:
- These candles occur after a downtrend. The downtrend should be evident, at least for a short term.
- The first candle of the piercing line pair is bearish, where the closing price is lower than the opening price.
- The second candle in the pair should be bullish. It should also show a gap down, with the opening price being lower than the previous candle’s closing price.
- Another significant indicator is that the bullish candle’s closing price (the green candle) should pierce the first candle’s body and go above its mid-point.
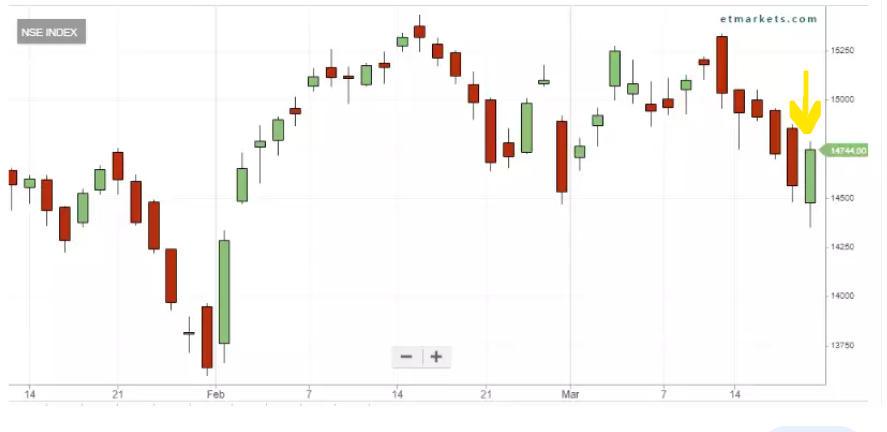
The above chart is an example of a piercing candlestick formation. The last two candles in the chart depict piercing candlesticks. As you can see, the downtrend is evident before the two candles. The last candle is green, suggesting a bullish reversal. The opening price shows a gap-down, and the closing price has reached beyond the previous candle’s mid-point, indicating a piercing pair.
Piercing candle: Formation and interpretation
The formation of a piercing pattern is the effect of bullish traders taking over the market from bearish traders.
The initial downtrend indicates a situation where the supply of stocks is higher than the demand, suggesting the stocks of bearish traders. This is where more traders are selling stocks over buying them.
The consecutive candle in the pair is formed when the bulls slowly start influencing the market and demand for buying stocks increases. However, the piercing pair only indicates a potential reversal. The pattern is confirmed if the next candle after the pair is bullish, too, and the candle’s opening price is significantly higher than the previous day’s closing.
How do you trade the piercing pattern?
Since the piercing pattern suggests the end of a downtrend and the beginning of a bull market, it may be the right to take long positions on the stock. It is also suitable to close a short position upon seeing a piercing pattern.
However, it is always advisable to confirm the trend with other indicators and the confirmation candle before formulating strategies. Another way to confirm if the reversal is strong is to analyse whether it is backed by an increase in the buying volume.
The reverse of a piercing candlestick
The piercing candlestick is a bullish reversal. Corresponding to this is the bearish piercing pattern, which is called the dark cloud candlestick. This is an indication of a bearish reversal.
A dark cloud pattern works the opposite way of a piercing candlestick. It consists of two candles appearing after an uptrend, with the former being bullish and the latter being bearish.
The second candle opens above the previous candle’s closing price, and closes below the midpoint of the previous candle, suggesting that bears are pulling the market down.
Bottomline
The piercing line is a simple and easy-to-identify candlestick pattern that suggests a bullish reversal. It usually appears after a downtrend, where bulls try to regain their power in the market.
The piercing line works best when it is combined with other technical indicators, which confirm the strength of the trend. Traders need to use this tool in unison with others since the piercing line is only an indication of a potential reversal and not a confirmed signal.
FAQs
The piercing pattern is a bullish reversal. It suggests a reversal after a downtrend, hinting at a potential uptrend. It is the effect of the bulls influencing the market stronger than the bears
The piercing pattern is rated as one of the most beneficial and fairly accurate candlesticks. However, it is never advisable to rely only on candlestick patterns while trading. Confirming trends with other indications is a must.
The two are quite similar in how they look. However, the bullish engulfing pattern suggests a stronger uptrend than a piercing pattern. While the second candle closes above the midpoint of the first in a piercing pattern, the bullish engulfing pattern has the second candle closing beyond the top of the first candle.
A dark cloud relates to a bearish reversal like a piercing line relates to a bullish reversal. A dark cloud suggests the beginning of bears dominating the market after an uptrend by the bulls. Contrary to that, a piercing line suggests bulls taking over the market after the bears maintain a downtrend.
The five-candle rule suggests observing five consecutive candles to confirm a pattern or a trend. However, it is criticised because it delays positions, due to which traders may lose profit-making opportunities.