Table of contents
Investors employ a variety of indicators while analysing stocks and trading to predict changes in the market. The simple moving average, or SMA, is often one of the most used among them.
As a fundamental tool in financial research, the simple moving average (SMA) strategy deserves an in-depth examination of its techniques, approaches, and applications. However, in essence, a simple moving average calculation takes a stock’s prices over a specific period and averages them out into a single trendline value.
But as simple as they are, these moving averages can reveal some hugely valuable trading signals when understood and applied correctly. In this article, we will get a closer look at SMA. So, let’s get started!
What is a simple moving trading strategy?
Among moving averages, the simple moving average stands out. It is generated by averaging data or prices over a predetermined period or even days. Financial analysts use it as a technical indicator.
The SMA line, which consists of the SMA values shown in an asset price chart, moves as new average values are produced. Expert traders may use SMA on asset prices within a certain range to analyse price movements, identify patterns, and determine when to enter and exit a trade.
In India, short-term traders usually employ 5-day, 10-day, or 15-day SMAs, whereas a 50-day SMA is often used to determine mid-term trends and is one of the most popular indicators.
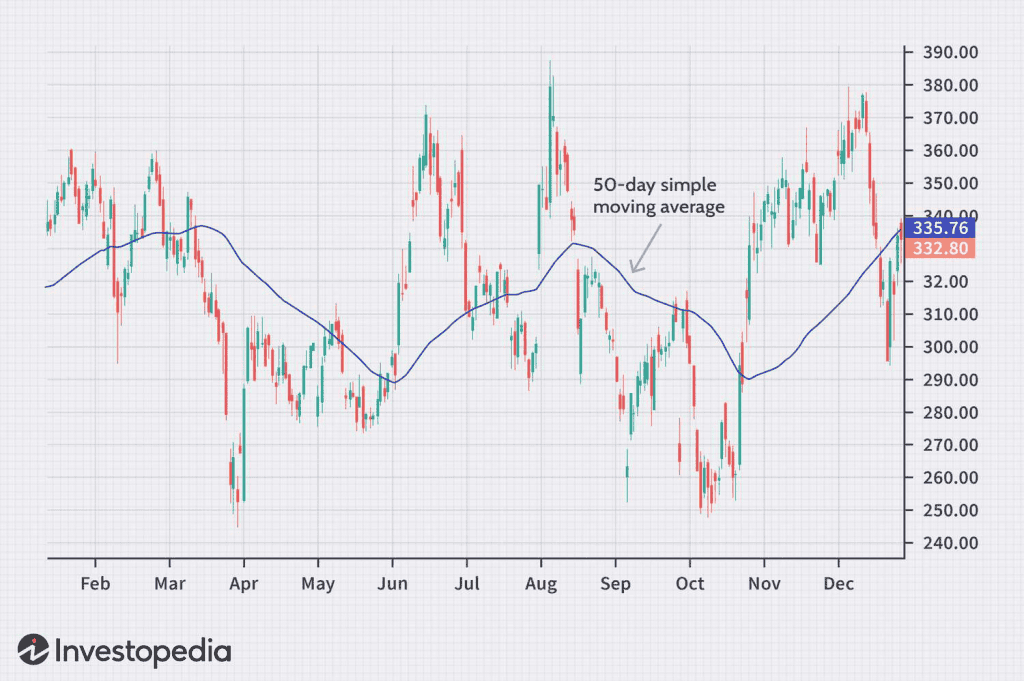
A general method involves adding up the closing prices of securities across many periods and then dividing the sum by the same number of periods. When the price of an underlying investment fluctuates, short-term averages react faster than long-term averages.
Along with simple moving averages, there are more advanced options, such as Weighted Moving Averages and Exponential Moving Averages (EMA).
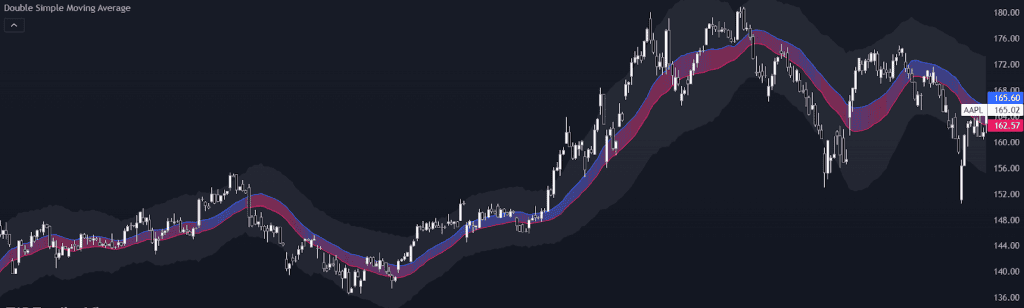
Similarly, for traders, the double or dual simple moving average trading strategy is a valuable indicator for spotting changing support and resistance levels and determining the direction of the trend. Here, you can see an SMA calculated on highs and one on lows. Furthermore, it uses the distance between the two primary lines to plot the deviation bands.
Simple moving average formula
Below is an illustration of the simple moving average formula, where An is the price of an asset at “n” periods and n is the number of total periods.
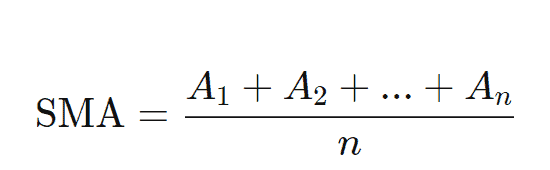
For instance, if a stock’s closing prices over the last five days have been ₹200, 220, 210, 230, and 250, then the 5-day simple moving average would be ₹222 = [(200+220+210+230+250)/5].
Features of simple moving average trading strategy
- Accurately reflecting prices
A simple moving average takes the average value over a specific period and uses it to smooth out price data. This feature makes it simpler to see long-term patterns by removing the noise of short-term price changes.
- Weighted equally among data points
A simple moving average gives equal weight to all data points within the selected period. By giving equal weight to previous and current data, you can ensure that they contribute to the average and don’t affect the indicator disproportionately.
- Identifying trends in real-time
A SMA can dynamically spot market trends. As a general rule, an uptrend indicates when prices are above the SMA, while a possible decline suggests when prices are below the SMA. Traders can better identify and validate the current market trend using this function.
- Timeframe flexibility
The flexibility and adaptability of simple moving averages make them useful for a variety of time frames. To better respond to price fluctuations, traders may use short-term simple moving averages, while those looking for a broader perspective of market patterns can use longer-term SMAs. Due to their adaptability, SMAs may be used with different trading approaches.
Difference between simple moving average and exponential moving average
| Simple moving average | Exponential moving average |
| All prices are given equal weight | Greater emphasis on current prices |
| Not as affected by recent changes | Greater responsiveness to new changes |
| SMA calculation involves the basic arithmetic average of prices | The complexity of calculating EMA goes beyond simple averages. |
| Typical in stability-based long-term analyses | It is recommended for use in shorter time frames due to its responsiveness |
| Quicker to signal potential trend changes | More gradual in signalling long-term trends |
Conclusion
Of course, no single indicator should be blindly followed, and SMAs have their limitations like any other indicator. However, when combined with other forms of analysis, SMAs can offer traders an objective framework for identifying high-probability, low-risk trade setups aligned with the current market momentum.
FAQs
Simple moving averages are used in day trading to identify trends and potential reversals. In the Indian context, traders often use SMAs like the 5-day, 10-day, or 15-day as short-term trend indicators. For instance, if the price is above a certain SMA, it may indicate an uptrend, suggesting a buying opportunity and vice versa. Traders also look for crossovers, where a short-term SMA crosses above a long-term SMA, indicating a bullish trend, or when it crosses below, suggesting a bearish trend.
The best SMA for trading depends on the trader’s strategy and the time frame they are focusing on. For short-term traders in India, the 10-SMA is popular as it provides a balance between responsiveness and smoothing out market noise. The 20-SMA is often used to identify primary trends, while the 50-SMA helps to gauge mid-term trends. Long-term trend followers might prefer the 200-SMA as it reflects longer-term market sentiment and is less prone to short-term fluctuations.
The 5 8 13 21 EMA strategy involves using EMAs of these periods to identify trading signals. This strategy is particularly responsive to price movements, making it suitable for Indian markets, where volatility can be high. Traders look for crossovers among these EMAs to spot potential entry or exit points. For example, a crossover of the 5 EMA above the 8, 13, and 21 EMAs may indicate a strong bullish trend, while the opposite crossover could signal a bearish trend.
For identifying trends, the choice of SMA can vary. In India, a common approach is to use a combination of SMAs like the 5, 8, and 13, which are Fibonacci-tuned and are effective in capturing short-term trends. The 50-SMA and 200-SMA are also widely used; the 50-SMA can help identify mid-term trends, while the 200-SMA is considered a benchmark for long-term trend analysis. Traders often watch these averages for crossovers and potential support or resistance levels.
The 200-day SMA and the 200-day EMA are both used to assess long-term trends, but they respond differently to price changes. The 200 SMA gives equal weight to all 200 days’ worth of price data, resulting in a smoother line that is slower to react to recent price movements. In contrast, the 200 EMA gives more weight to recent prices, making it more responsive to new information and quicker to reflect current market conditions.