Table of contents
Picture the stock market as a narrative. Every day unfolds a new chapter, each with its unique symbol – a candlestick. A candlestick pattern reveals the story of market participants, reflecting their emotions, concerns, and anticipations.
One particular pattern catches the eye with its fascinating characteristics – the stalled candlestick pattern. Similar to an unexpected turn in a story, it indicates a temporary halt in the market’s progress, generating a feeling of excitement among traders.
In this article, we’ll explore the intricacies of this pattern, providing insights into its formation and the impact it has on the exciting world of trading.
Understanding candlestick charts
Traders often rely on candlestick charts to gain insights into the price movements of a security during a specific time frame. These charts have a rich history, originating from Japanese rice merchants and traders centuries ago.
On the chart, each candlestick stands for a different period and displays the four key prices: opening, closing, high, and low.
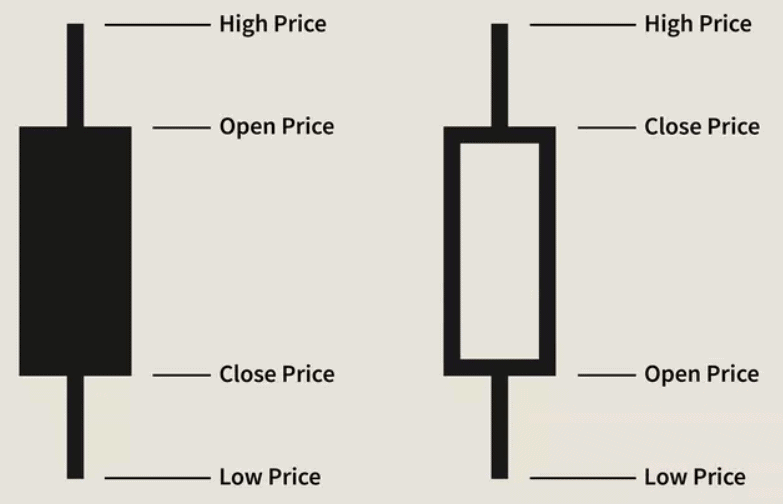
Shadows or lines show high and low prices, while the candlestick body shows opening and closing prices. The candlestick’s colour reflects whether the closing price surpassed or fell short of the opening price.
What is a Stalled Pattern?
A stalled pattern is a distinctive formation that can be observed on a candlestick chart when there is an ongoing uptrend, indicating a possible shift towards a bearish reversal. A deliberation pattern is another name for this pattern.
The stalled pattern is characterised by three bullish candles that meet specific criteria. The price at which each candle opens and closes should be greater than that of the preceding candle. The third candle, on the other hand, has a real body that is shorter compared to the other two, along with a long upper shadow.
The formation of a bearish reversal is usually signalled when the subsequent candle falls below the midpoint of the second candle’s body. It should be noted that a stalled pattern is not necessarily indicative of a bearish reversal. This pattern indicates a temporary decline in bullish strength and a shift in investor sentiment towards negativity.
Example of a stalled candlestick pattern
To further grasp the stalled pattern candlestick, let’s examine a hypothetical case.
The shares of ABC Co are currently trading at Rs 200, having doubled from Rs 100 over the past month due to a strong bullish trend. Upon closer examination of the stock’s candlestick pattern, the following observations can be made:
- The initial two candles exhibit significant bullishness, suggesting a robust buying interest that has propelled the price from Rs 100 to Rs 200.
- The third candle appears to be shorter, with a long upper shadow, indicating a potential decrease in buying momentum.
- The distance between the second candle’s closing price and the third candle’s opening is small.
This formation is a classic example of a stalled pattern. It hints that the bullish trend might be nearing its end and a bearish reversal could be imminent.
You should closely monitor the subsequent candles. If the next candle falls below the midpoint of the second candle’s real body, it would confirm the bearish reversal.
Interpreting a stalled pattern
Candlestick patterns are key tools in predicting future market trends. They emerge from both negative (decreasing) and positive (increasing) price movements. One such pattern, the stalled candlestick pattern, is particularly useful for traders and investors in identifying signals and forecasting market direction.
The stalled candlestick pattern is formed by three successive bullish candles, indicating an ongoing market uptrend. The first two candles, notable for their significant length, represent the sustained power of buyers actively purchasing securities.
On the other hand, these candles’ length suggests potential exhaustion, which could indicate a change in market attitude towards pessimism. This shift is definitively confirmed by the appearance of the third candle.
The stalled candlestick pattern is completed by the third candle, which is shorter than the previous two and either rests on or shows a gap up on the shoulder of the second candle.
This candle serves as a strong indicator of the prevailing bullish trend’s exhaustion and confidently suggests an upcoming bearish market direction. To make sure the results are compatible with other analyses, it’s important to use other technical indicators with the stalled candlestick pattern study.
Stalled pattern vs. bearish reversal
| Stalled pattern | Bearish reversal | |
| Definition | A three-candle pattern that occurs while the market is on an upward trend. | A trend change from positive to negative can be seen in this pattern. |
| Formation | Comprises two extended bullish candles followed by a smaller one featuring a lengthy upper shadow. | Various forms can be observed, including a head and shoulders pattern, double top, or rising wedge. |
| Indication | Indicates that the upward trend could be approaching its conclusion. | Suggests a potential downward movement in price. |
What Are the Limitations of the Stalled Candlestick Pattern?
The stalled candlestick pattern is commonly used by traders to identify potential trend reversals, especially in a bullish market. However, despite its usefulness, it comes with several limitations:
- False Reversal Signals: The stalled candlestick pattern might give a false signal, especially in volatile or range-bound markets. It can appear to indicate a potential trend reversal, but the price may continue in the same direction, leading to losses for traders who act prematurely.
- Requires Confirmation: The stalled candlestick pattern alone may not be sufficient to make trading decisions. Traders often need additional confirmation from other technical indicators, such as volume, RSI, or moving averages, to validate the potential reversal. Relying solely on the pattern could lead to incorrect predictions.
- Context-Dependent: The reliability of the stalled candlestick pattern is highly dependent on the market context. It is more effective in certain market conditions (e.g., trending markets) than others. In a choppy or sideways market, the pattern may be less reliable, and traders might not get the expected outcomes.
- Short-Term Focus: The stalled candlestick pattern is a short-term signal, and its effectiveness diminishes over longer time frames. It works best on shorter time charts (e.g., 15-minute or hourly charts) and may not provide reliable signals on daily or weekly charts.
- Market Noise: In highly volatile markets, the stalled pattern may appear frequently due to market noise. This can make it difficult for traders to distinguish between valid signals and random price movements, leading to potential confusion and losses.
What Does the Stalled Candlestick Pattern Indicate?
The stalled candlestick pattern is a reversal signal, primarily observed in bullish trends. It typically consists of two candlesticks:
- The first candlestick is a long bullish candle, followed by a smaller candlestick that fails to close above the high of the previous bullish candle. This “stall” suggests that the momentum driving the current bullish trend is weakening.
Here’s what the pattern indicates:
- Weakening Bullish Momentum: The stalled candlestick pattern suggests that buying pressure is fading, and the current uptrend may be losing steam. This could be an early indication that the market is about to reverse or consolidate.
- Potential Bearish Reversal: The pattern is typically viewed as a bearish reversal signal, suggesting that after a period of strong upward movement, the market may shift into a downtrend or start a correction.
- Increased Selling Pressure: After the stalled candlestick forms, it indicates that sellers may be entering the market, gradually overpowering the buyers. This could signal the start of a bearish phase or a significant pullback.
- Trend Exhaustion: The pattern reflects exhaustion of the current trend, where the market’s upward movement slows down or stalls, indicating that the bulls are no longer in control, and bears could soon take over.
Bottomline
Understanding the stalled candlestick pattern is crucial for traders and investors as it provides valuable insights into potential market trends.
Nevertheless, it is crucial to keep in mind that although these patterns can offer some guidance, they are not infallible and should be incorporated into a more comprehensive trading strategy. It’s important to consider other technical indicators alongside the analysis of the stalled pattern for a more thorough market analysis.
FAQs
A Doji Star Bearish is a reversal pattern used in the technical analysis of stocks to predict a potential trend shift from bullish to bearish. It occurs during an uptrend and consists of two candles: a long green candle followed by a Doji. A Doji, appearing like a cross or plus sign, signifies that the opening and closing price of a stock are virtually the same. This pattern generally indicates a trend reversal stage after a long uptrend.
A pause candlestick is a candle that forms during a trend, typically indicating a pause in fresh positions by market participants. It often has the opposite colour to the trend, i.e., if the trend is upward, the pause candle will be red and vice versa. This pattern can signal an entry opportunity for traders expecting reversals or those who missed the initial trend.
The 15-minute candlestick strategy is a popular setup for day traders. It involves analysing the first 15-minute candle after the market opens. Traders mark the high and low of this candle, which serve as reference points for entering trades. If the market trends upwards, the risk-to-reward ratio is high, increasing the chances of success. Patience is crucial as early entries often lead to losses. This strategy requires practice and proper execution.
In the context of stock trading, FNO stands for Futures and Options. These are financial derivatives that allow traders to speculate on the price movements of an underlying asset without actually owning it. Futures contracts obligate the buyer to purchase an asset, while options contracts give the buyer the right, but not the obligation, to buy or sell the asset. These instruments are used to hedge market risks and are traded on the stock exchange.
Intraday trading, which involves buying and selling stocks within the same trading day, can be profitable. However, it’s a high-risk, high-reward strategy that requires careful market analysis and a steady hand. Success often comes from building small profits through many trades throughout the day, rather than making a huge profit in one go. However, if predictions don’t work out, significant losses can occur compared to regular trading.