Table of contents
In the complex world of stock investing, fundamental analysis is one of the processes that investors find most reliable. Since fundamental analysis calculates the internal value of a stock and determines whether it’s over or undervalued, it comes close to predicting how the market will eventually react price-wise.
Of course, fundamental analysis doesn’t depend on just one variable or metric. Its strength lies in the process of checking and double-checking the numbers in every way until predictions are sufficiently reinforced.
One crucial metric in this process is the XIRR, meaning Extended Internal Rate of Return. XIRR is a robust and popular metric that goes beyond what’s attainable by other traditional measures. It unveils the true story behind numbers, accounting for the timing and magnitude of both cash inflows and outflows.
In this article, we’re going to dive into XIRR’s meaning, what it can be used for, how to calculate XIRR, and why you should use it the next time you’re fundamentally analysing a stock.
What is the XIRR?
The Extended Internal Rate of Return is the return you get on your recurring investments. If you have an SIP in a mutual fund and you invest a certain sum every month, the XIRR will help you understand what you’re actually earning. Essentially, this metric is used when returns have to be calculated with multiple transactions.
This also comes in handy in more sophisticated investment strategies where investors get the option to have an early exit or withdrawal from a long-term investment strategy. Some also skip instalments and still want to know how much they’re making.
If you invested ₹100 in a mutual fund and withdrew ₹110 at the end of the year, you simply made 10% on your investments. And that’s enough information for most people.
However, in more complicated investment ventures, investors need to know which time period made the most returns, which deposits came up with losses, and when they should consider reinvesting. That’s where the XIRR comes in.
How to calculate XIRR on excel?
Microsoft Excel is an excellent XIRR calculator. This is the formula template you can use:
XIRR (value, dates, guess)
How to use the formula:
- Enter all your transactions in one column. Correspondingly, enter the dates for all transactions. Make sure that your SIP purchases are marked negative (outflow) and redemption or selling transactions are marked positive (inflow).
- In the last row, mention the current value of your investments with the current date. Make sure your first investment date along with your redemption date is accurate.
- Now, use the XIRR function using the above formula template.
- Now, in place of “values” select the cash flows, in place of “dates” use the date column, and the “guess” is optional. Excel uses 0.1 by default if you don’t make an entry of your own.
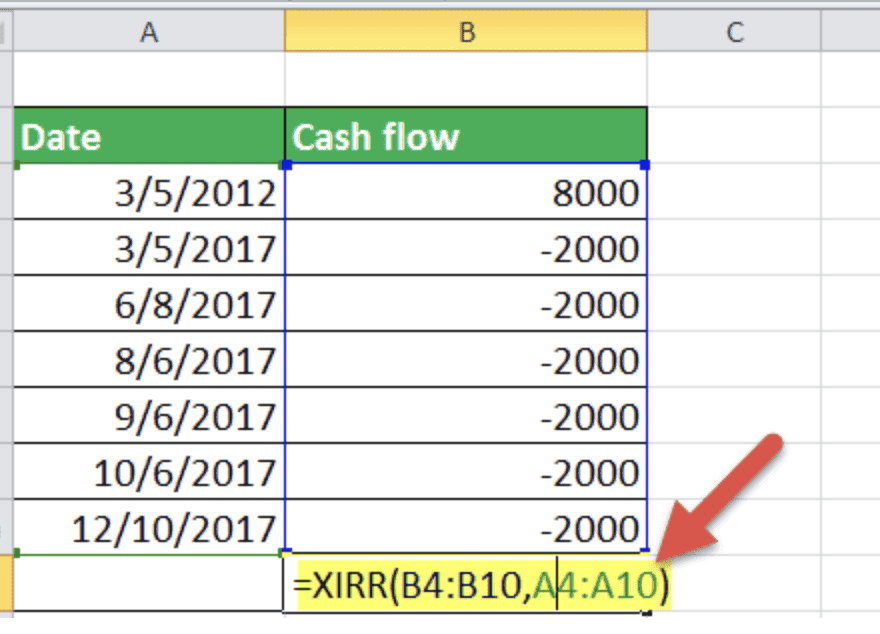
When the formula is placed currently and the data is accurate, the cell returns a single numerical value. This is your XIRR. It is the consolidated return of your investments considering the timings of your investments and withdrawals.
Additionally, you can make use of any online XIRR calculator to easily perform the calculation.
Importance of XIRR
- Accurate performance evaluation: XIRR, accounting for the timing and magnitude of cash flows, provides a nuanced comparison against absolute return, highlighting the complexity of investment evaluations. This contrast emphasises the importance of understanding XIRR vs absolute return for accurate financial analysis.
- Irregular cash flow management: Unlike CAGR, XIRR can effectively handle investments with irregular cash flows, making it ideal for SIPs with varying contributions.
- Time value of money: It incorporates the time value of money, reflecting the true timing of investments and offering a realistic view of returns.
- Comparative analysis: Enables comparison across investments with different cash flow patterns, facilitating informed decision-making.
- Portfolio performance: Assists in assessing the performance of diversified portfolios, helping investors gauge the effectiveness of their diversification strategy.
- Informed decision-making: By offering a more accurate view of returns, XIRR empowers investors to make better choices about their investment strategies and financial goals.
Why not use the CAGR?
We’re assuming you’re using an SIP to invest in a mutual fund. Most people use a Consolidated Annual Growth Rate (CAGR) calculation to gauge how good the returns from a particular fund are. These could be 3-year, 5-year, or even 10-year CAGRs.
Here’s the simple difference between a CAGR and XIRR.
CAGR, by principle, calculates the adjusted return of a lump-sum investment over a given period of time assuming no adjustments, deductions, or additions. So, the CAGR doesn’t really take into account SIPs, where you invest a fixed amount every month.
But what is XIRR returns? It has the ability to take into account irregular and regular purchases, withdrawals, and even missed payments and consolidate them into the return calculation. For those who want more accurate reports of what they made on any investment, XIRR is the way to go.
Conclusion
XIRR is a fantastic tool to use to gauge if your investments are giving you the returns you want. Generally, an XIRR of around 12% is considered decent for equity-based mutual funds. For funds that invest in debt, anything above 7% should be a good benchmark.
FAQs
A good XIRR rate varies with investment types and market conditions. For equity-based mutual funds, an XIRR of around 12% is generally considered decent, indicating a strong return on investment given the risk. For debt investments, an XIRR over 7% is viewed favourably, reflecting a good return for the lower risk involved. These benchmarks help investors assess their investment performance, factoring in cash flow timings and the specific nature of their investment, ensuring a more accurate evaluation of returns.
XIRR is often considered better than CAGR for evaluating certain investments due to its more nuanced approach. XIRR accurately accounts for multiple cash flows over time, making it particularly suitable for investments like SIPs, where contributions and withdrawals occur at irregular intervals. By considering the timing of each transaction, XIRR provides a detailed measure of return, offering a clearer picture of an investment’s performance compared to the more generalised growth rate calculated by CAGR, especially in complex investment scenarios.
XIRR is calculated for SIP investments by considering the timing and amount of each cash flow. In Excel, use the XIRR function with two main inputs: a list of all cash flows and the corresponding dates of these cash flows. The formula takes into account the irregular intervals of SIP transactions, providing an annualised return that reflects the true performance of your investment, considering the impact of each contribution and withdrawal over time.
If XIRR is negative, it indicates that the investment has generated a loss over the period analysed. Essentially, the total value of cash outflows (investments) has not been adequately compensated by the cash inflows (returns, withdrawals). A negative XIRR is a clear signal that the investment’s performance has been below expectations, leading to a decrease in the initial capital. Investors should review such investments to understand the causes of underperformance and consider adjusting their investment strategy or portfolio accordingly.
XIRR and ROI (Return on Investment) differ significantly. ROI calculates the percentage gain or loss on an investment relative to its initial cost, not accounting for the time factor or cash flow timing. XIRR, however, offers an annualised return rate that factors in the timing and size of all cash inflows and outflows, providing a more detailed performance analysis for investments with irregular transactions.